


- SpreadJS Overview
- Getting Started
- JavaScript Frameworks
- Best Practices
-
Features
- Workbook
- Worksheet
- Rows and Columns
- Headers
- Cells
- Data Binding
- Data Manager
- TableSheet
- GanttSheet
- ReportSheet
- Data Charts
- JSON Schema with SpreadJS
- SpreadJS File Format
- Data Validation
- Conditional Formatting
- Sort
- Group
- Formulas
- What-If Analysis
- Serialization
- Keyboard Actions
- Shapes
- Floating Objects
- Barcodes
- Charts
- Sparklines
- Tables
- Pivot Table
- Slicer
- Theme
- User Management
- Culture
- AI Assistant
- SpreadJS Designer
- SpreadJS Designer VSCode Plugin
- Tutorials
- SpreadJS Designer Component
- SpreadJS Collaboration Server
- Touch Support
- Formula Reference
- Import and Export Reference
- Events
- API Documentation
- Release Notes
Pivot Table Components
This topic covers the basic information related to pivot table components and their terminology.
The below image shows the Pivot Area (containing a pivot table) and Pivot Panel in a spreadsheet.
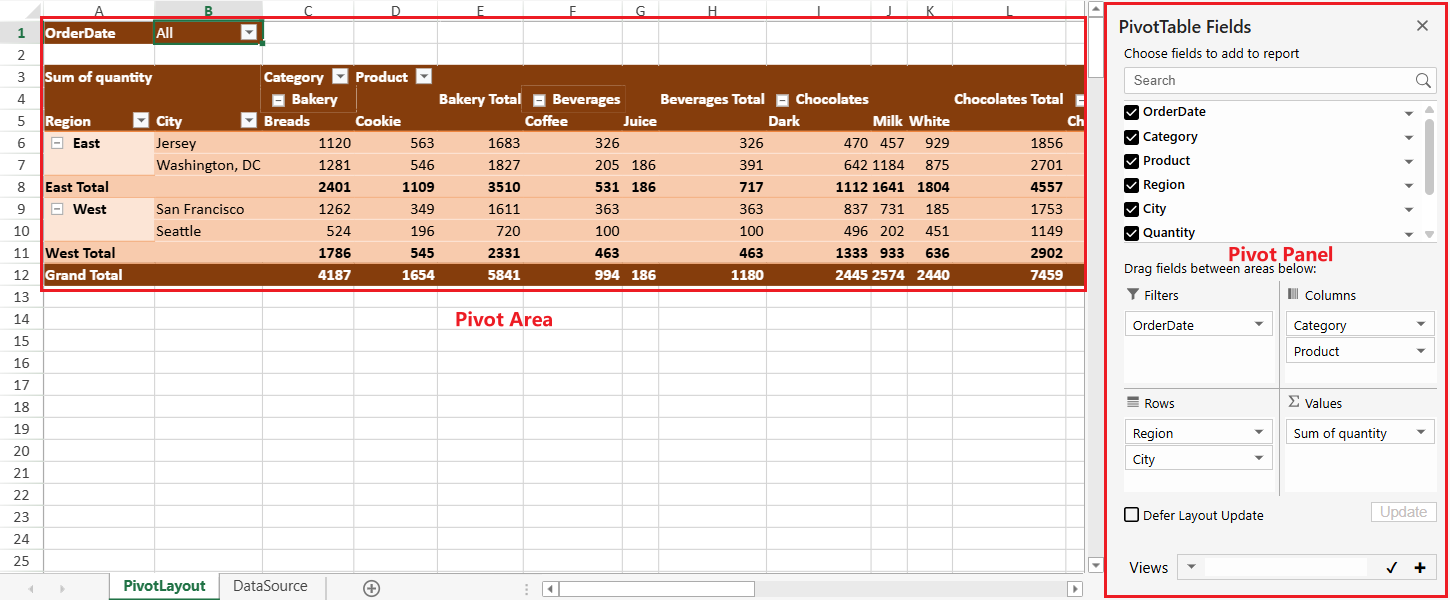
Pivot Area
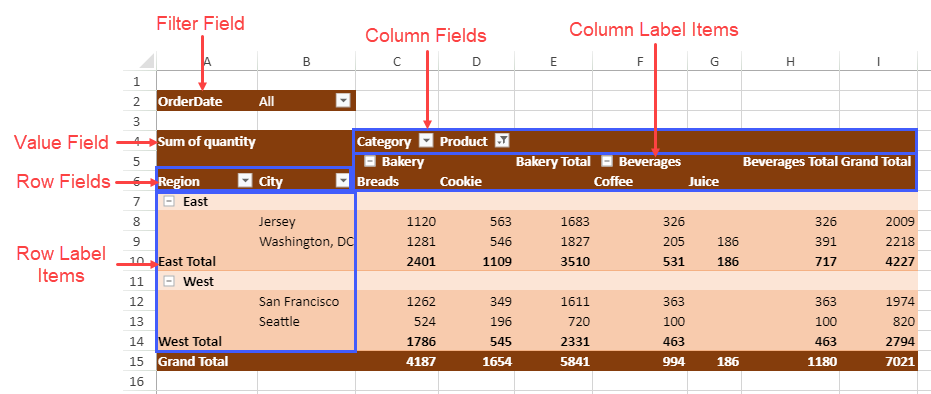
The pivot area displays the pivot table which contains various fields and label items as shown in the below image:
Pivot Panel
The pivot panel is a task pane that can be used to add, remove, drag, and move fields in a pivot table. The pivot table panel consists of PivotTable Fields, PivotTable Area, and Pivot View Manager section as shown in the below image:
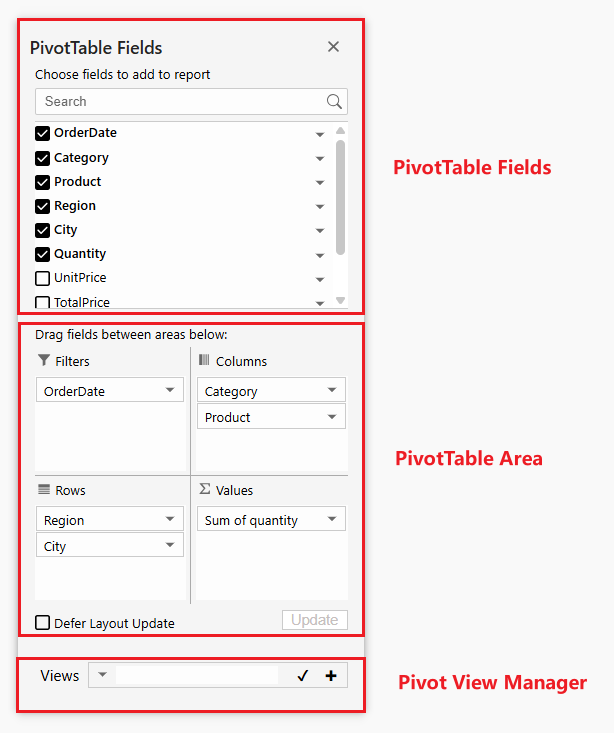
You can also customize the layout of the pivot panel by using the panelLayout option. The above image shows the default panel layout (stack) whereas the below image shows the 'flow' pivot panel.
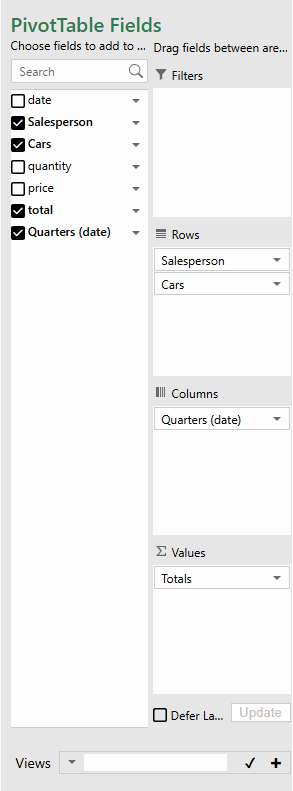
The following code sample sets the pivot panel layout to flow:
var layoutType = panel.panelLayout();
panel.panelLayout(GC.Spread.Pivot.PivotPanelLayoutType.flow);
By default, the pivot panel has a fixed size. However, you can resize the pivot pane by hovering your mouse over the left edge until the pointer changes to a double-headed arrow, then left-click, and drag. This allows you to view the long field names, if available.
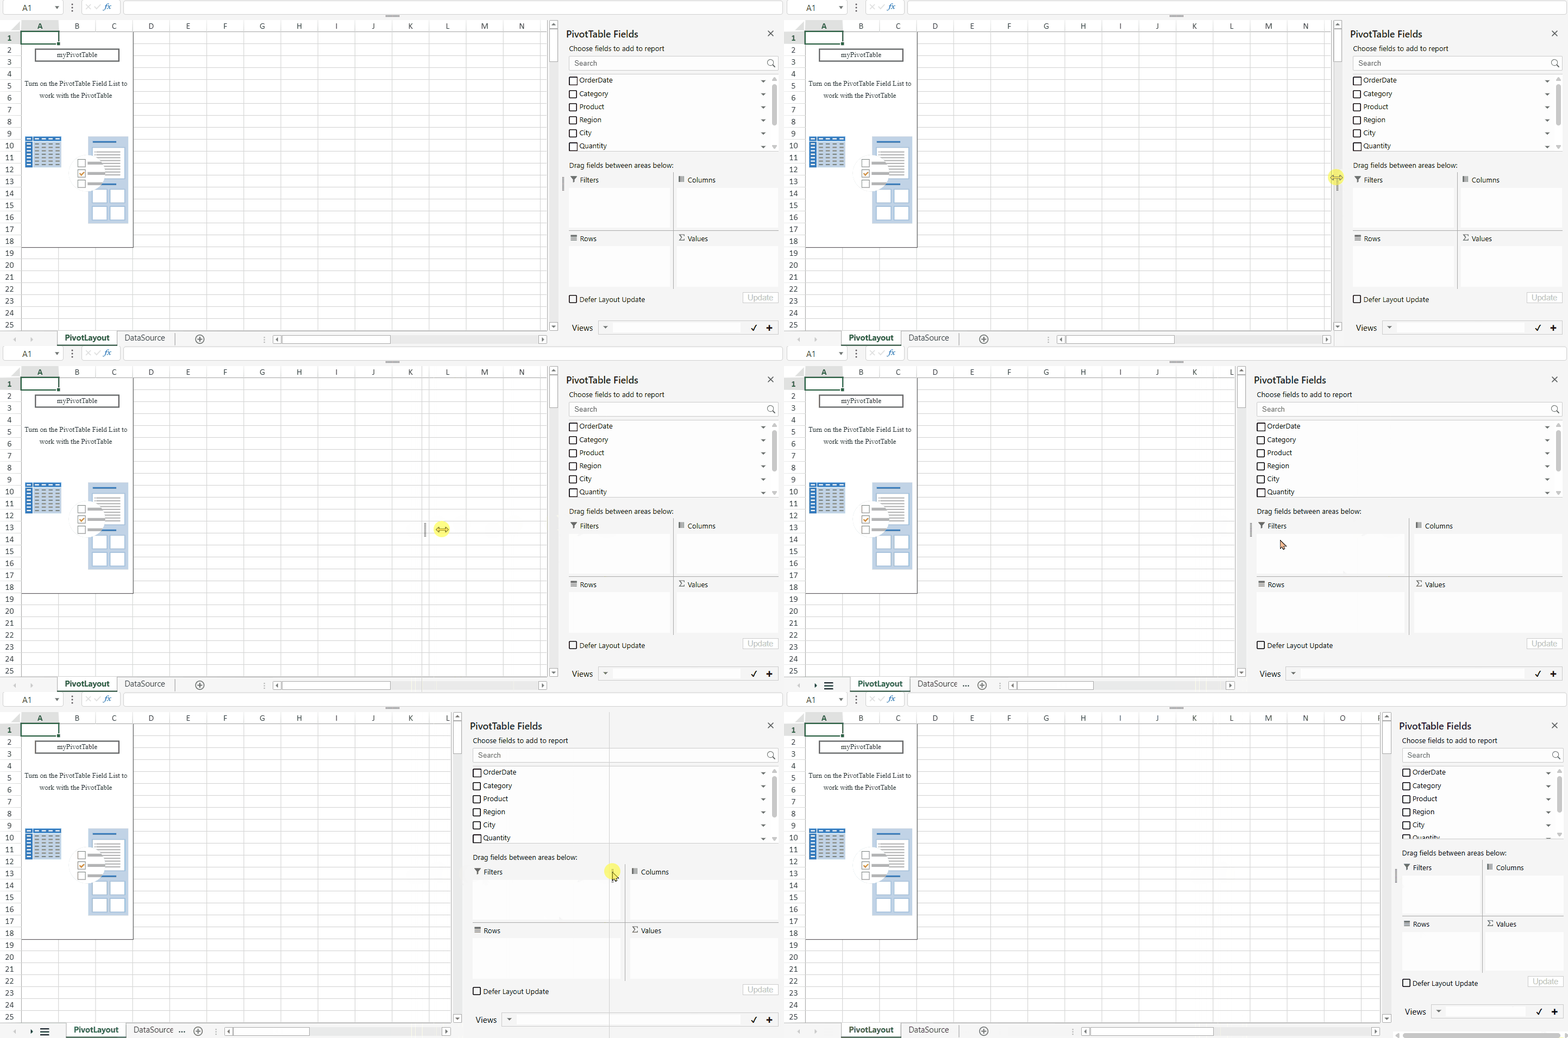
To get a resizable pivot panel, you need to change the default configuration settings of the SpreadJS designer in the DefaultConfig variable of the Designer namespace.
The following code sample sets the resizable pivot panel in the DefaultConfig:
let designer = new GC.Spread.Sheets.Designer.Designer("designer-container");
var config = GC.Spread.Sheets.Designer.DefaultConfig;
let pivotPanelIndex = config.sidePanels.findIndex((item) => item.uiTemplate === "pivotTablePanelTemplate");
config.sidePanels[pivotPanelIndex].allowResize = true;
config.sidePanels[pivotPanelIndex].showResizeLine = true
config.sidePanels[pivotPanelIndex].minWidth = "200px";
config.sidePanels[pivotPanelIndex].maxWidth = "800px";
designer.setConfig(config);
Pivot Table Fields
The Pivot Table Fields section displays the fields from the data source, which can be added to a pivot table. You can select or unselect these fields to get the desired pivot table view.
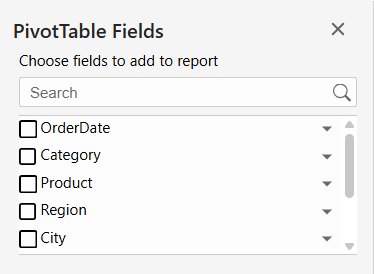
The following code sample shows how to hide the PivotTable Fields section from the pivot panel.
// Hide the "PivotTable fields" section
var panel = new GC.Spread.Pivot.PivotPanel("myPivotPanel", myPivotTable, document.getElementById("panel"));
panel.sectionVisibility(GC.Spread.Pivot.PivotPanelSection.area | GC.Spread.Pivot.PivotPanelSection.viewList);
Field List for DataManager Views
When a PivotTable uses a DataManager View as its source, the PivotTable Fields section can group source fields by table if the View exposes fields from multiple DataManager tables.
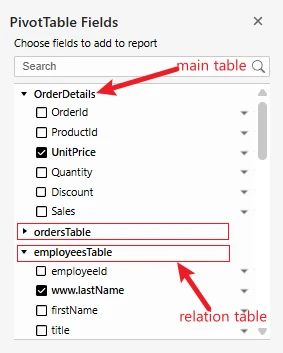
The main table is displayed first. Related tables are displayed as peer groups in a two-level table and field layout. Table group headers are used only to organize the field list. Select or drag the fields under each group to add them to the PivotTable.
When fields are grouped, tooltips in the source field list and PivotTable area fields display the complete source field name, including the full relation path.
This grouping affects only the Pivot Panel display. The original source field names are not changed, and PivotTable analysis continues to use the complete field names exposed by the DataManager View.
If the DataManager View exposes fields from only one table, the field list remains flat. DataManager Table sources and worksheet range sources also use the existing flat field list.
Search Box
The Pivot Table Fields section provides a search box above the field list, allowing you to quickly locate fields in large data sources.
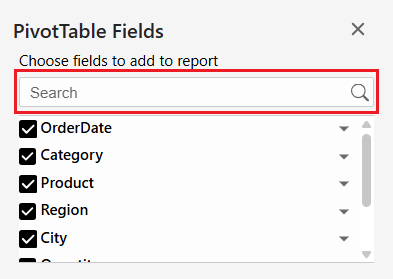
Notes:
Matching is case-insensitive and supports wildcards (
?for a single character,*for any sequence of characters).If no fields match the keyword, the field list displays "No matches".
Press Esc to clear the search box and reset the field list.
PivotTable Area
The Pivot Table Area is a section of the pivot panel which displays the row, column, value, and filter fields of a pivot table. You can simply drag and drop the pivot table fields across these areas to switch between different pivot table views.
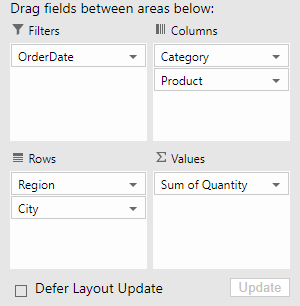
The following table describes the above areas:
Area | Description |
|---|---|
Rows | Displays as rows in a pivot table with Row Labels as the values for selected fields. |
Columns | Displays as columns in a pivot table with Column Labels as the values for selected fields. |
Filters | Used for filter operation in a pivot table. |
Values | Displays the statistics data for the selected field. |
The following code sample shows how to hide the Pivot Table Area section from the pivot panel.
// Hide the "PivotTable Area" section
var panel = new GC.Spread.Pivot.PivotPanel("myPivotPanel", myPivotTable, document.getElementById("panel"));
panel.sectionVisibility(GC.Spread.Pivot.PivotPanelSection.fields | GC.Spread.Pivot.PivotPanelSection.viewList);
Pivot View Manager
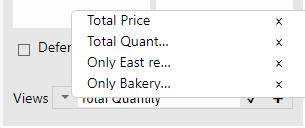
The Pivot view manager can be used to manage views of the pivot table. It can quickly restore the state of the pivot table saved at a certain moment. The following image shows the different saved views of the pivot table in the view manager.
The following code sample shows how to hide the Pivot View Manager section from the pivot panel.
// Hide the "Pivot View Manager" section
var panel = new GC.Spread.Pivot.PivotPanel("myPivotPanel", myPivotTable, document.getElementById("panel"));
panel.sectionVisibility(GC.Spread.Pivot.PivotPanelSection.fields | GC.Spread.Pivot.PivotPanelSection.area);
For more details, refer to the Pivot View Manager topic.