


- SpreadJS Overview
- Getting Started
- JavaScript Frameworks
- Best Practices
-
Features
- Workbook
- Worksheet
- Rows and Columns
- Headers
- Cells
- Data Binding
- Data Manager
- TableSheet
- GanttSheet
- ReportSheet
- Data Charts
- JSON Schema with SpreadJS
- SpreadJS File Format
- Data Validation
- Conditional Formatting
- Sort
- Group
- Formulas
- What-If Analysis
- Serialization
- Keyboard Actions
- Shapes
- Floating Objects
- Barcodes
- Charts
- Sparklines
- Tables
- Pivot Table
- Slicer
- Theme
- User Management
- Culture
- AI Assistant
- SpreadJS Designer
- SpreadJS Designer VSCode Plugin
- Tutorials
- SpreadJS Designer Component
- SpreadJS Collaboration Server
- Touch Support
- Formula Reference
- Import and Export Reference
- Events
- API Documentation
- Release Notes
Create Pivot Table
A pivot table is managed using the PivotTable and PivotTableManager classes. To create a pivot table, follow the below steps:
Add a data source to the project.
Create a pivot table using the add method.
Use PivotTableFieldType enumeration to display data into various fields.
You can choose to create a pivot table using either a normal data source or an existing table as the source. Additionally, this feature supports selecting a full column as the data source, but the first row, which must contain field names, cannot be empty. However, this feature does not support relative references.
Using JSON as a Data Source
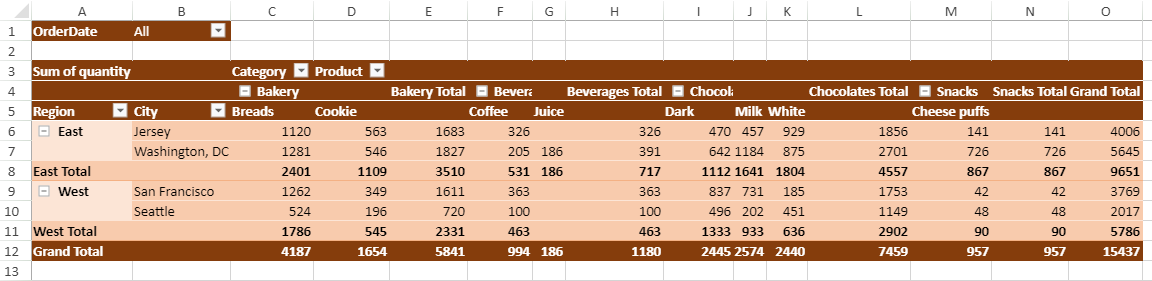
You can create a pivot table by using JSON as a data source. For example, a food sales company sells food and beverage products across different countries and maintains sales data of products daily. By using the JSON data source, a pivot table can be created which can present meaningful insights, like:
The total quantity of each product sold across different countries
The total quantity of products sold in each city
A pivot table can easily categorize the sales data and calculate the subtotals and grand totals automatically as shown in the image below.
The following code sample creates the pivot table and adds fields to the field area.
window.onload = function () {
    // initializing Spread
    var spread = new GC.Spread.Sheets.Workbook(document.getElementById("ss"), { sheetCount: 2 });
    spread.suspendPaint();

    // get sheets
    var pivotLayoutSheet = spread.getSheet(0);
    var dataSourceSheet = spread.getSheet(1);

    // set sheet name
    pivotLayoutSheet.name("PivotLayout");
    dataSourceSheet.name("DataSource");

    // set row count
    dataSourceSheet.setRowCount(245);

    // set datasource
    dataSourceSheet.setArray(0, 0, pivotDB_UseCase);

    // add table to dataSourceSheet
    dataSourceSheet.tables.add("tableSales", 0, 0, 245, 8);

    spread.resumePaint();

    // initialize pivottable
    initPivotTable(pivotLayoutSheet);

    // auto fit columns in both the sheets
    autoFit(pivotLayoutSheet);
    autoFit(dataSourceSheet);
};

function initPivotTable(sheet) {
    // add pivottable
    var myPivotTable = sheet.pivotTables.add(
        "myPivotTable",
        "tableSales",
        0,
        0,
        GC.Spread.Pivot.PivotTableLayoutType.tabular,
        GC.Spread.Pivot.PivotTableThemes.dark3
    );

    myPivotTable.suspendLayout();

    // show rowHeader and columnHeader for PivotTable
    myPivotTable.options.showRowHeader = true;
    myPivotTable.options.showColumnHeader = true;

    // add column fields
    myPivotTable.add("Category", "Category", GC.Spread.Pivot.PivotTableFieldType.columnField);
    myPivotTable.add("Product", "Product", GC.Spread.Pivot.PivotTableFieldType.columnField);

    // add row fields
    myPivotTable.add("Region", "Region", GC.Spread.Pivot.PivotTableFieldType.rowField);
    myPivotTable.add("City", "City", GC.Spread.Pivot.PivotTableFieldType.rowField);

    // add value field with SubtotalType Sum
    myPivotTable.add("Quantity", "Sum of quantity", GC.Spread.Pivot.PivotTableFieldType.valueField, GC.Pivot.SubtotalType.sum);

    // add filter field
    myPivotTable.add("OrderDate", "OrderDate", GC.Spread.Pivot.PivotTableFieldType.filterField);

    myPivotTable.resumeLayout();
    return myPivotTable;
}

function autoFit(sheet) {
    // auto fit columns
    var columnCount = sheet.getColumnCount();
    for (var i = 0; i < columnCount; i++) {
        sheet.autoFitColumn(i);
    }
}
Using TableSheet as a Data Source
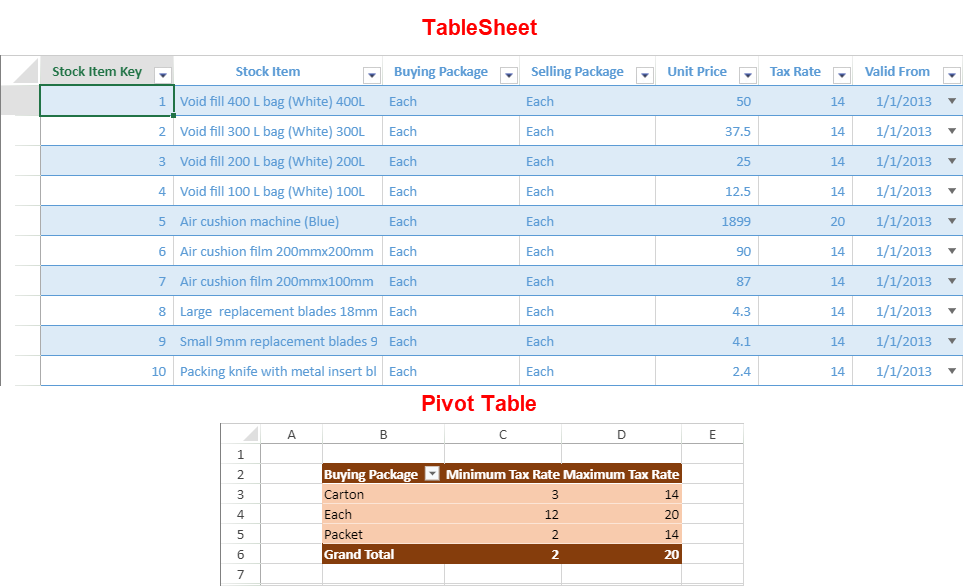
You can create a pivot table using the tablesheet as a data source reference. It helps to easily access the data to compare and display the information in both the pivot table and tablesheet. It also allows you to add calculated fields in the pivot table from the tablesheet for better analysis of data.
The PivotTableManager.add method accepts the tablesheet name as a sourceData parameter value.
For example, the following image shows a pivot table that summarizes the stock information such as the minimum and maximum tax rates on buying packages using data from a tablesheet.
The following code sample shows how to create a pivot table using the data from an existing tablesheet in SpreadJS.
//init a table sheet
var sheet = spread.addSheetTab(0, "TableSheet1", GC.Spread.Sheets.SheetType.tableSheet);
var tableSheetName = "TableSheet1";

//bind a view to the table sheet
myTable.fetch().then(function () {
    var view = myTable.addView("myView", [

        { value: "stockItemKey", width: 150, caption: "Stock Item Key" },
        { value: "stockItem", width: 120, caption: "Stock Item" },
        { value: "buyingPackage", width: 120, caption: "Buying Package" },
        { value: "sellingPackage", width: 120, caption: "Selling Package" },
        { value: "unitPrice", width: 150, caption: "Unit Price" },
        { value: "taxRate", width: 120, caption: "Tax Rate" },
        { value: "validFrom", width: 200, caption: "Valid From" }
    ]);
    sheet.setDataView(view);
}).then(() => {
    var ptSheet = spread.getSheet(0);
    var myPivotTable = ptSheet.pivotTables.add("pivot1", "TableSheet1", 1, 1, GC.Spread.Pivot.PivotTableLayoutType.outline, GC.Spread.Pivot.PivotTableThemes.dark3);

    // add row fields
    myPivotTable.add("buyingPackage", "Buying Package", GC.Spread.Pivot.PivotTableFieldType.rowField);

    // add value field with SubtotalType Minimum and maximum
    myPivotTable.add("taxRate", "Minimum Tax Rate", GC.Spread.Pivot.PivotTableFieldType.valueField, GC.Pivot.SubtotalType.min);
    myPivotTable.add("taxRate", "Maximum Tax Rate", GC.Spread.Pivot.PivotTableFieldType.valueField, GC.Pivot.SubtotalType.max);

    // autoFit columns
    for (let i = 1; i < 4; i++) {
        ptSheet.autoFitColumn(i);
    }

});
The pivot table uses the data that is currently accessible in the tablesheet, except in the following instances:
The pivot table cannot contain any newly added groups from the tablesheet after a grouping operation.
The pivot table displays the data of a field even if it is set to hide in the tablesheet.
The column in a pivot table uses the column name of a tablesheet and not its set caption. Thus, the calculated columns will have a very long name in the pivot table.
Using DataManager Table or View as a Data Source
You can create a PivotTable directly from a DataManager Table or View. This allows PivotTable analysis to use structured DataManager data without first materializing the data into a worksheet table or TableSheet.
Use a DataManager Table source when the PivotTable analyzes fields from a single table. Use a DataManager View source when the PivotTable needs fields exposed by a view, such as projected fields, filtered results, calculated fields, or relation-based fields from multiple tables.
A PivotTable created from a DataManager Table or View uses DataManager data to create or refresh its PivotCache. After the cache is created, PivotTable analysis operates on the PivotCache data.
Create a PivotTable from a DataManager Table
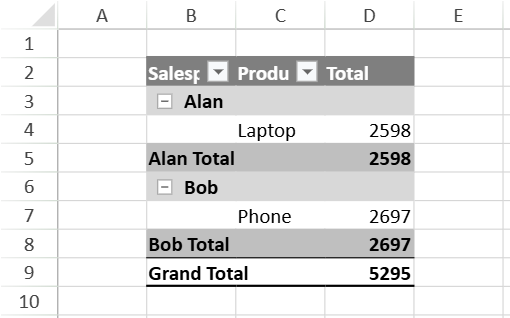
The PivotTable source descriptor uses the DataManager table name as the source value. Fetch the table data before creating the PivotTable.
var dataManager = spread.dataManager();

var salesTable = dataManager.addTable("TableSales", {
    data: [
        { date: new Date(2024, 0, 1), salesperson: "Alan", product: "Laptop", quantity: 2, price: 1299, total: 2598 },
        { date: new Date(2024, 0, 2), salesperson: "Bob", product: "Phone", quantity: 3, price: 899, total: 2697 }
    ],
    schema: {
        columns: {
            date: { dataType: "date" },
            salesperson: { dataType: "string" },
            product: { dataType: "string" },
            quantity: { dataType: "number" },
            price: { dataType: "number" },
            total: { dataType: "number" }
        }
    }
});

salesTable.fetch().then(function () {
    var sheet = spread.getSheet(0);

    var pivotTable = sheet.pivotTables.add(
        "dataTablePivot",
        {
            source: "TableSales",
            autoRefresh: true
        },
        1,
        1,
        GC.Spread.Pivot.PivotTableLayoutType.outline,
        GC.Spread.Pivot.PivotTableThemes.medium8
    );

    pivotTable.add("salesperson", "Salesperson", GC.Spread.Pivot.PivotTableFieldType.rowField);
    pivotTable.add("product", "Product", GC.Spread.Pivot.PivotTableFieldType.rowField);
    pivotTable.add("total", "Total", GC.Spread.Pivot.PivotTableFieldType.valueField, GC.Pivot.SubtotalType.sum);
});
Create a PivotTable from a DataManager View
The PivotTable source descriptor uses the table name and view name as the source value, in the format "TableName.ViewName".
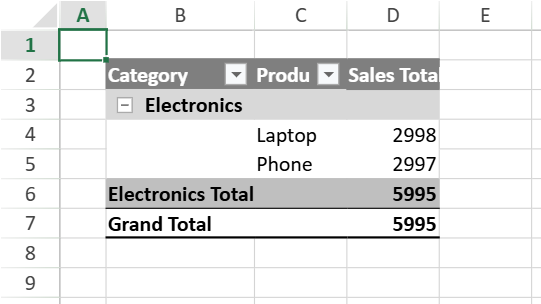
A DataManager View is the recommended source when the PivotTable needs relation-based fields or a table-like result assembled from multiple DataManager tables. The PivotTable does not interpret the DataManager relationship model directly. It consumes the fields and rows exposed by the View.
var dataManager = spread.dataManager();

var productsTable = dataManager.addTable("Products", {
    data: [
        { id: 1, name: "Laptop", category: "Electronics", price: 1299 },
        { id: 2, name: "Phone", category: "Electronics", price: 899 }
    ],
    schema: {
        columns: {
            id: { dataType: "number", isPrimaryKey: true },
            name: { dataType: "string" },
            category: { dataType: "string" },
            price: { dataType: "number" }
        }
    }
});

var salesTable = dataManager.addTable("Sales", {
    data: [
        { date: new Date(2024, 0, 1), productId: 1, quantity: 2, price: 1499 },
        { date: new Date(2024, 0, 2), productId: 2, quantity: 3, price: 999 }
    ],
    schema: {
        columns: {
            date: { dataType: "date" },
            productId: { dataType: "number" },
            quantity: { dataType: "number" },
            price: { dataType: "number" },
            salesTotal: { dataType: "formula", value: "=[@quantity] * [@price]" }
        }
    }
});

dataManager.addRelationship(salesTable, "productId", "product", productsTable, "id", "sales");

var salesAnalysisView = salesTable.addView("SalesAnalysisView", [
    "date",
    "quantity",
    "price",
    "salesTotal",
    "product",
    "product.name",
    "product.category"
]);

Promise.all([
    productsTable.fetch(),
    salesTable.fetch(),
    salesAnalysisView.fetch()
]).then(function () {
    var sheet = spread.getSheet(0);

    var pivotTable = sheet.pivotTables.add(
        "dataViewPivot",
        {
            source: "Sales.SalesAnalysisView",
            autoRefresh: true
        },
        1,
        1,
        GC.Spread.Pivot.PivotTableLayoutType.outline,
        GC.Spread.Pivot.PivotTableThemes.medium8
    );

    pivotTable.add("product.category", "Category", GC.Spread.Pivot.PivotTableFieldType.rowField);
    pivotTable.add("product.name", "Product", GC.Spread.Pivot.PivotTableFieldType.rowField);
    pivotTable.add("salesTotal", "Sales Total", GC.Spread.Pivot.PivotTableFieldType.valueField, GC.Pivot.SubtotalType.sum);
});
Automatically Refresh DataManager Sources
Set autoRefresh to true in the PivotTable source descriptor to refresh the related PivotCache automatically when the DataManager Table or View changes.
var pivotSource = { source: "TableSales", autoRefresh: true};If autoRefresh is not enabled, you can refresh the PivotCache explicitly by calling updateSource() on the PivotTable. For more information, see Data Settings.
Note: If a DataManager source contains no data records, SpreadJS can use its schema to create an empty PivotTable.