
- SpreadJS Overview
- Getting Started
- JavaScript Frameworks
- Best Practices
-
Features
- Workbook
- Worksheet
- Rows and Columns
- Headers
- Cells
- Data Binding
- Data Manager
- TableSheet
- GanttSheet
- ReportSheet
- Data Charts
- JSON Schema with SpreadJS
- SpreadJS File Format
- Data Validation
- Conditional Formatting
- Sort
- Group
- Formulas
- What-If Analysis
- Serialization
- Keyboard Actions
- Shapes
- Floating Objects
- Barcodes
- Charts
- Sparklines
- Tables
- Pivot Table
- Slicer
- Theme
- User Management
- Culture
- AI Assistant
- SpreadJS Designer
- SpreadJS Designer VSCode Plugin
- Tutorials
- SpreadJS Designer Component
- SpreadJS Collaboration Server
- Touch Support
- Formula Reference
- Import and Export Reference
- Events
- API Documentation
- Release Notes
Group and Collapse
SpreadJS allows you to use group and collapse operations in a pivot table which makes it easier to get a clear view and display only the required data. This is particularly helpful when the pivot table contains lots of data that can be summarized further. You can group the data by date, text, and numbers as explained in the below section.
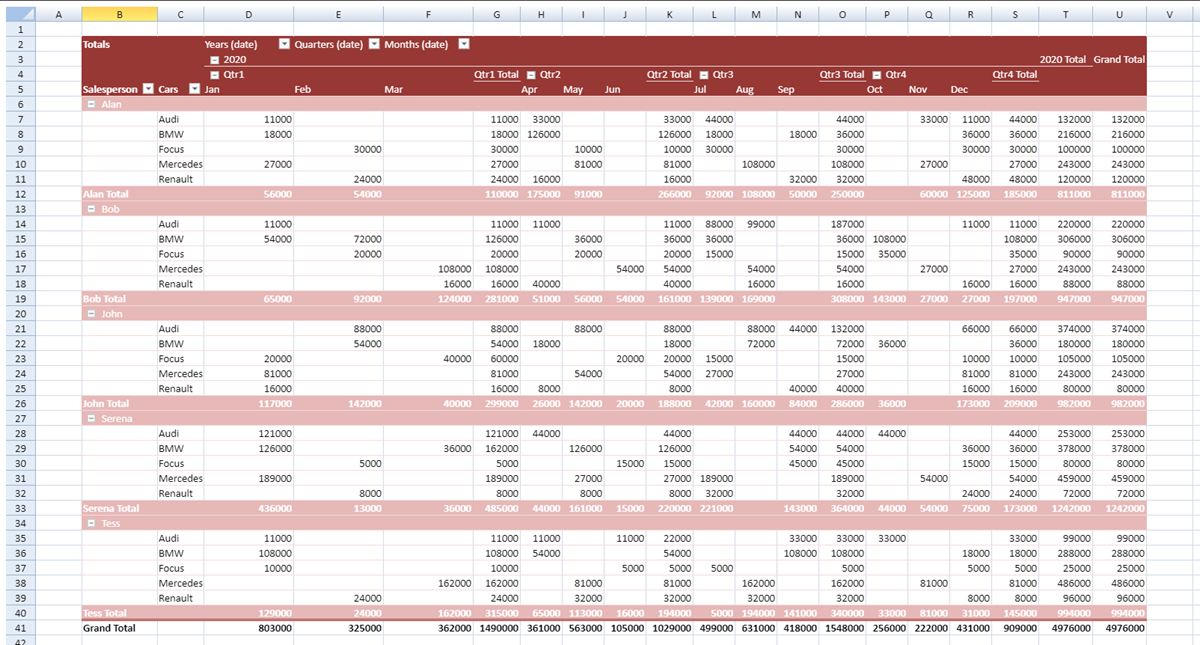
Group Date
SpreadJS allows you to group and ungroup datetime fields in pivot tables. You can group data by common intervals—such as seconds, minutes, hours, days, months, quarters, or years—and you can also define custom ranges, like a 7‑day interval (for a weekly view) or any other span that fits your scenario. In addition, you can specify the timeline’s start and end points. The dateGroups property supports these options.
The following image shows the data grouped quarterly for 2020.
The following code sample shows how to group date data by quarters.
// Group by dates
 let groupInfo = {
     originFieldName: "date", dateGroups: [
         { by: GC.Pivot.DateGroupType.quarters },
         { by: GC.Pivot.DateGroupType.years },
         { by: GC.Pivot.DateGroupType.months }
     ]
 };
 pivotTable.group(groupInfo);
 pivotTable.add("Years (date)", "Years (date)", GC.Spread.Pivot.PivotTableFieldType.columnField);
 pivotTable.add("Quarters (date)", "Quarters (date)", GC.Spread.Pivot.PivotTableFieldType.columnField);
 pivotTable.add("Months (date)", "Months (date)", GC.Spread.Pivot.PivotTableFieldType.columnField);
Auto Date Group
SpreadJS supports automatic date grouping when a date-type field is added to a PivotTable through the PivotTable Panel.
When enabled, the date field is automatically grouped into a date hierarchy—such as Years, Quarters, Months, and other time units—without requiring manual grouping.
By default, this feature is disabled to maintain backward compatibility.
Enable Auto Date Group
You can enable automatic date grouping either at runtime or in the Designer.
Enable via
PivotTableChangingEvent
sheet.bind(GC.Spread.Sheets.Events.PivotTableChanging, function (sender, args) {
    args.autoGroupDateField = true;
});
Setting args.autoGroupDateField = true enables automatic grouping for the date field being added.
Enable via Designer Configuration
designer.setData("autoGroupPivotDateField", true);This configuration has the same effect as setting args.autoGroupDateField = true in the PivotTableChanging event.
Grouping Rules
The grouping levels are determined based on the date range of the field.
SpreadJS identifies the minimum and maximum date values in the field and determines the grouping hierarchy according to the range between them.
The range is evaluated hierarchically from: Year → Month → Day → Hour → Minute → Second.
The grouping levels are selected based on the highest and lowest differing components, as shown below.
Highest Differing Component | Lowest Differing Component | Group By |
|---|---|---|
Year | Any | Years, Quarters, Months |
Month | Any | Months, Days |
Day | Day | No Grouping |
Hour | Days, Hours | |
Minute | Days, Hours, Minutes | |
Second | Days, Hours, Minutes, Seconds | |
Hour | Hour | Hours |
Minute | Hours, Minutes | |
Second | Hours, Minutes, Seconds | |
Minute | Any | Hours, Minutes |
Second | Any | Hours, Minutes, Seconds |
Notes:
If the minimum and maximum dates are identical, no grouping is applied.
If the calculated range does not require hierarchy expansion, grouping may be minimal or skipped.
If the data source changes or the pivot table refreshes, the start and end dates are updated to reflect the new minimum and maximum values.
If the date field contains null or empty values, automatic grouping is not applied.
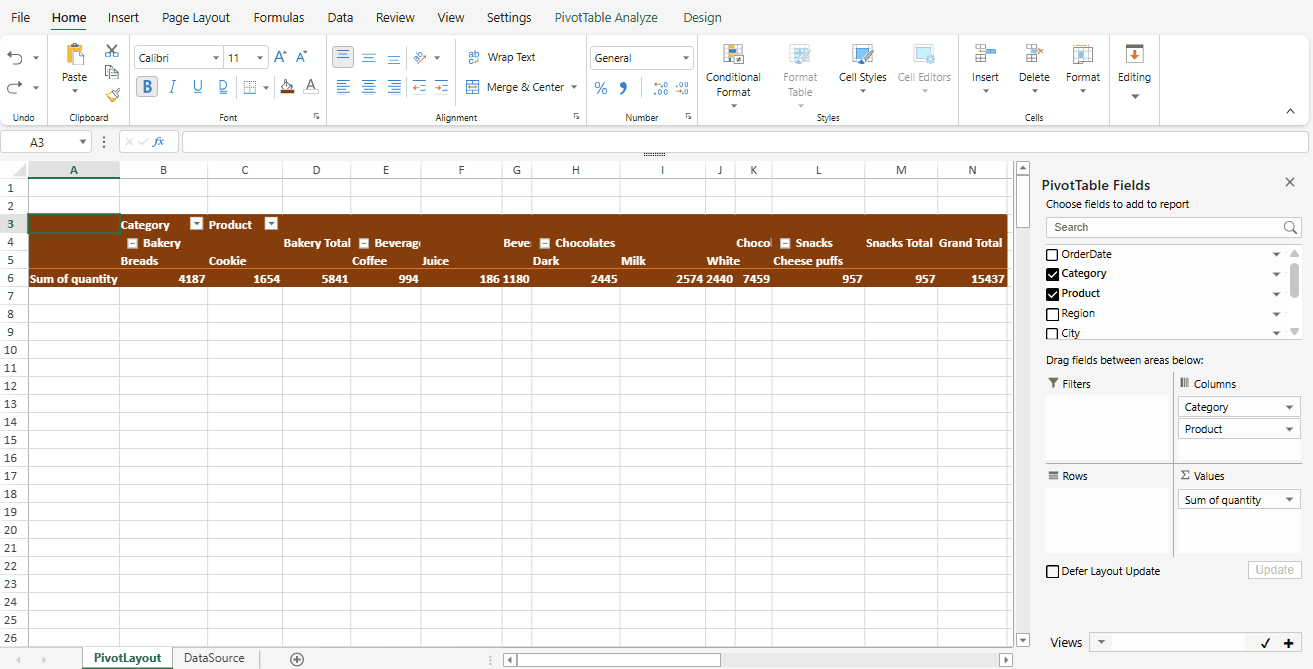
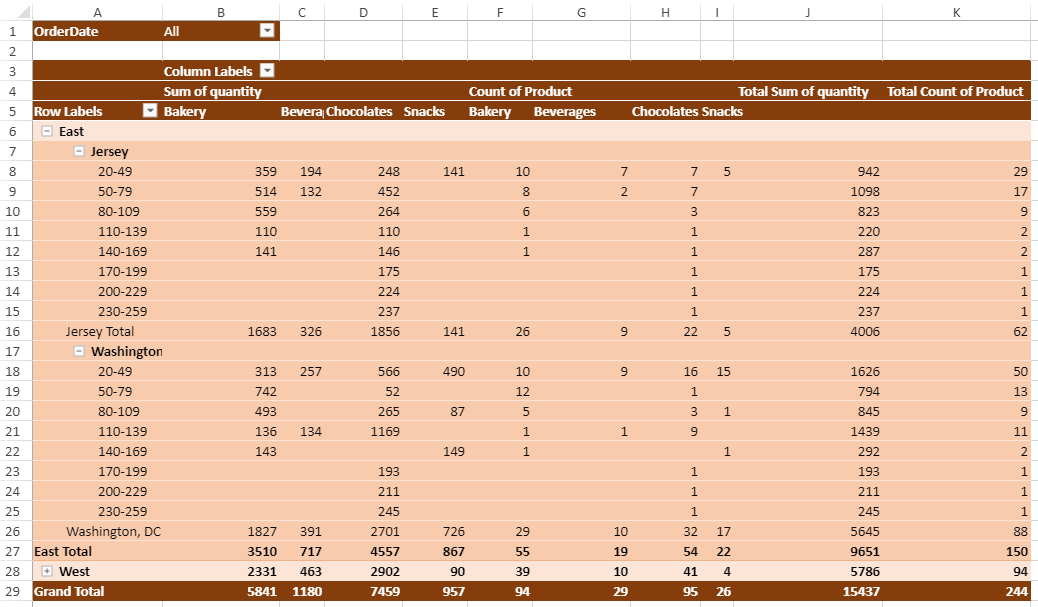
Group Text
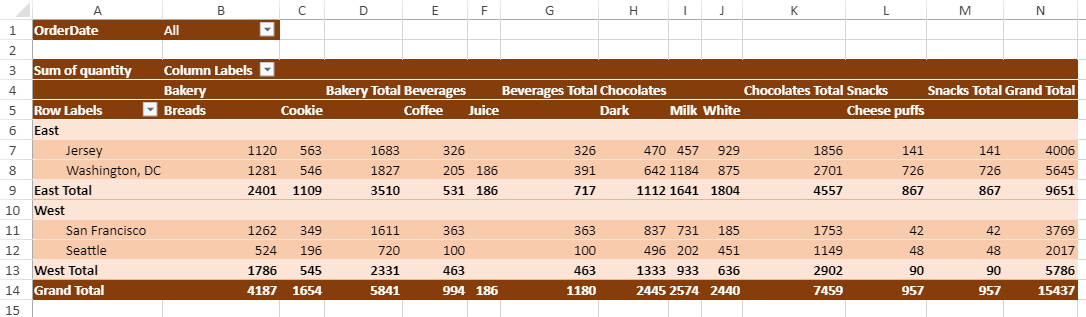
In a pivot table, you can also group the Row label or Column Label items by using the textGroup method. It uses the add method to add a new group to the pivot table. When a text group is added, a new field is also created.
The following image shows the new group created by row label items.
The following code sample shows how to group the text of row label items.
// Group by items
myPivotTable.views.apply("empty_pt");
myPivotTable.add("Region", "Region", GC.Spread.Pivot.PivotTableFieldType.rowField);
myPivotTable.add("Quantity", "Sum of quantity", GC.Spread.Pivot.PivotTableFieldType.valueField, GC.Pivot.SubtotalType.sum);
let groupInfo = {
    originFieldName: "Product", textGroup: {
        fieldName: "NewProduct",
        groupItems: {
            Drinks: ['Coffee', 'Juice'],
            Chocolate: ['Dark', 'White', 'Milk'],
            Others: ['Breads', 'Cheese puffs', 'Cookie']
        }
    }
};
myPivotTable.group(groupInfo);
myPivotTable.add("NewProduct", "TestProduct", GC.Spread.Pivot.PivotTableFieldType.columnField);
In addition, developers can use the groupInterval option to define custom intervals measured in days. For example, the following sample shows how to group dates into 7‑day blocks (a weekly view).
// Group by custom ranges
const pivotTable = sheet.pivotTables.add("PivotTable", source, 1, 1, GC.Spread.Pivot.PivotTableLayoutType.outline, GC.Spread.Pivot.PivotTableThemes.medium3);
let groupInfo = {
    originFieldName: "Date", dateGroups: [
        { by: GC.Pivot.DateGroupType.days, groupInterval: 7 }
    ]
};
pivotTable.group(groupInfo);
pivotTable.add("Days (date)", "Days (date)", GC.Spread.Pivot.PivotTableFieldType.rowField);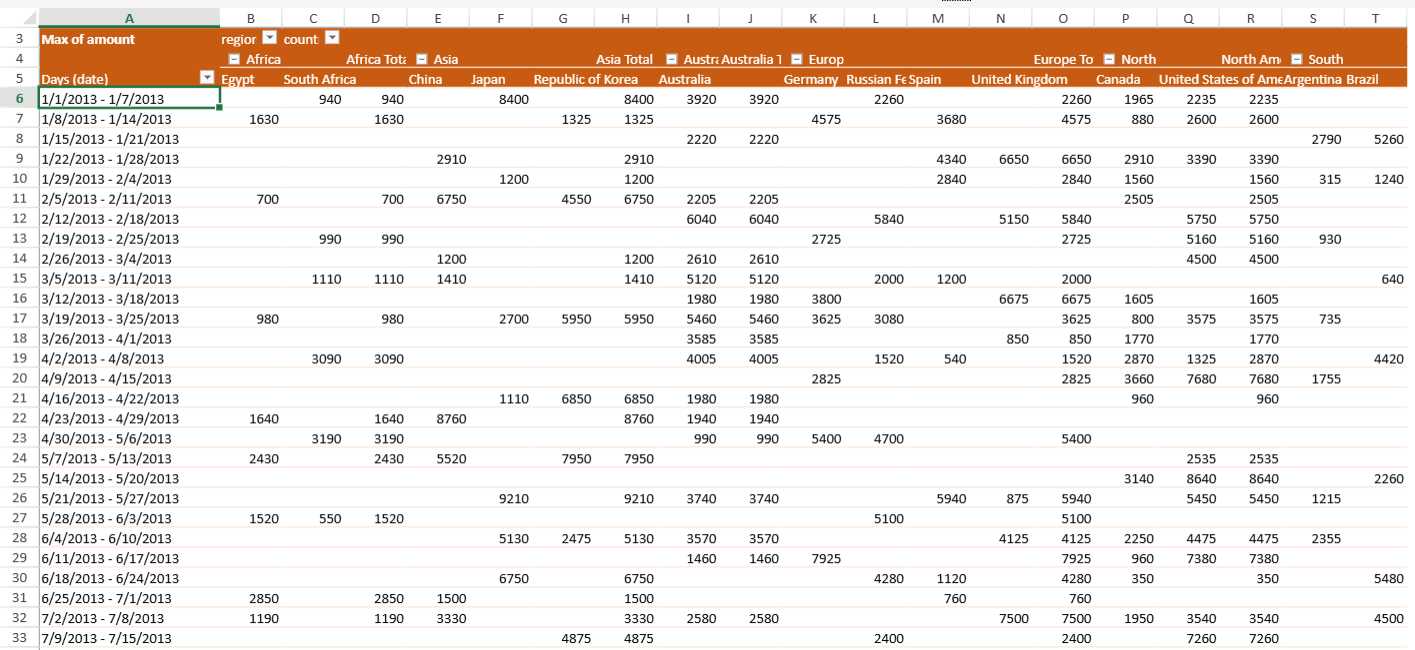
Notes:
The
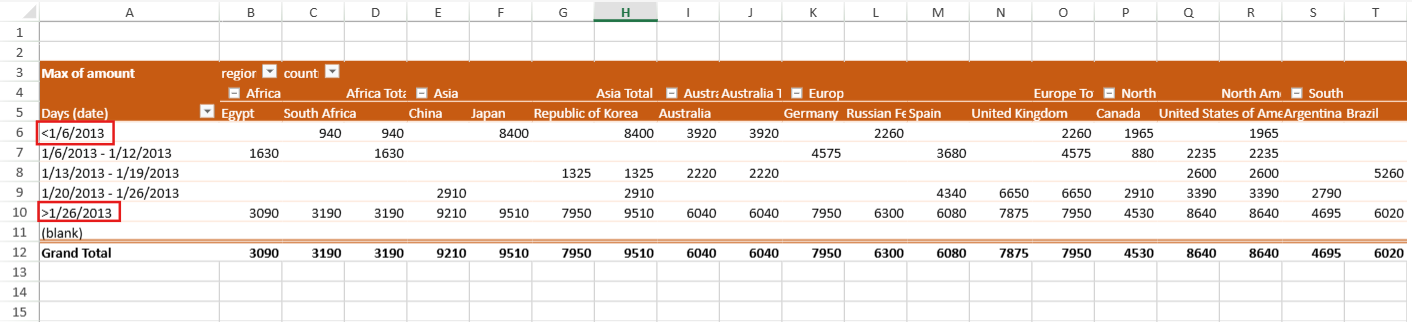
groupIntervaloption only works when the grouping is strictly by days.When the timeline contains data outside the specified start or end range, those items will be placed in a special group. In the output, these groups are marked with “<” or “>” symbols joined to the boundary date, as shown in the figure.
The smallest unit recognized in this mode is a day. This means if the start date is 2/3/2025 08:30:30 AM, the grouping system will treat it as 2/3/2025 00:00:00 AM.
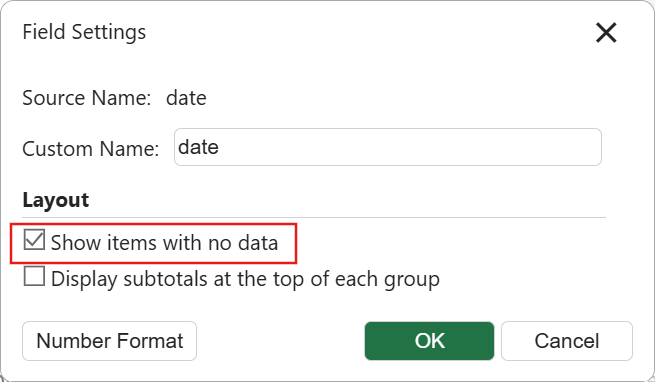
It’s possible for some grouped intervals to have no records. If you prefer to keep those intervals visible—for example, to highlight gaps in your data—you can turn on the Show items with no data option. This option is off by default.
Group Numbers
You can group the numerical values instead of listing them individually in a Row field while creating frequency distribution tables. This helps in analyzing numerical values by grouping them into ranges. You can use the numberGroup method to group numerical values. The following image shows the frequency distribution of quantity within the group.
The following code sample shows how to group numbers.
// group by numbers
myPivotTable.views.apply("empty_pt");
myPivotTable.add("Quantity", "Quantity", GC.Spread.Pivot.PivotTableFieldType.rowField);
myPivotTable.add("Region", "Region", GC.Spread.Pivot.PivotTableFieldType.colField);
myPivotTable.add("Product", "Count of quantity", GC.Spread.Pivot.PivotTableFieldType.valueField, GC.Pivot.SubtotalType.count);
let groupInfo = { originFieldName: "Quantity", numberGroup: { by: 30 } };
myPivotTable.group(groupInfo);
Collapse Groups
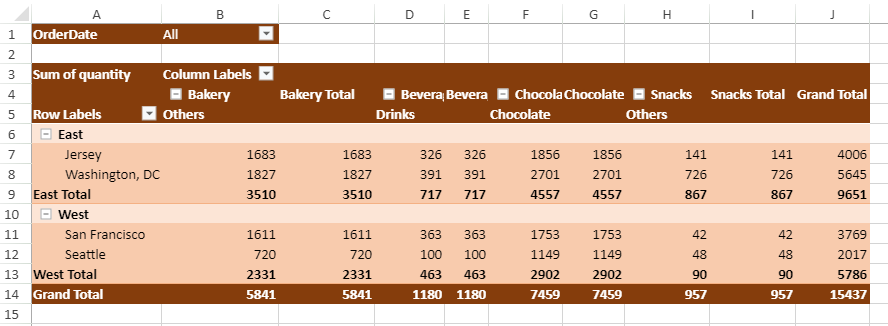
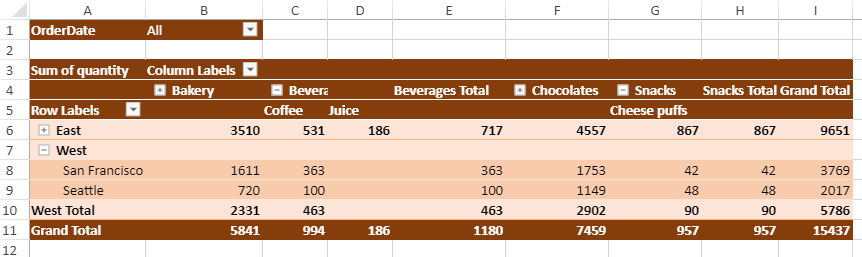
You can expand or collapse specific groups or entire pivot fields in a pivot table by using the collapse option. The following image shows the East region, Bakery, and Chocolates category fields as collapsed.
The following code sample shows how to collapse and expand groups.
// collapse some groups
myPivotTable.collapse("Region", "East", true);
myPivotTable.collapse("Category", "Bakery", true);
myPivotTable.collapse("Category", "Chocolates", true);
// expand region group
myPivotTable.collapse("Region", "East", false);
Hide Collapse button
You can show or hide the expand and collapse buttons (+ or - sign buttons on the left of the pivot item heading) in a pivot table using the showDrill option.
The following code sample shows how to hide expand and collapse buttons in the pivot table.
myPivotTable.options.showDrill = false;