


- Document Solutions Data Viewer Overview
- Key Features
- Getting Started
- User Interface
- Load File
- Resize Rows and Columns
- Cell Range Selection
- Tables
- Pivot Tables
- Sorting and Filtering
- Grouping and Outlines
- Data Visualization
- Scroll Bars
- Notes
- Search Data
- Extract Data
- Hyperlinks
- Keyboard Shortcuts
- Samples
- Client-side API Reference
- Release Notes
User Interface
DsDataViewer provides a familiar easy-to-use interface so that end-users can perform few operations at run-time to view data as per requirement. The control mainly comprises of three parts:
Toolbar
DsDataViewer toolbar is a set of buttons on top of the control which lets you perform basic functions on the viewer or its components such as opening a document or zooming the data display area.

In fullscreen view, this main toolbar changes to a mini-toolbar that gets displayed towards the bottom. Mini-toolbar also displays the same options as that of main default toolbar.
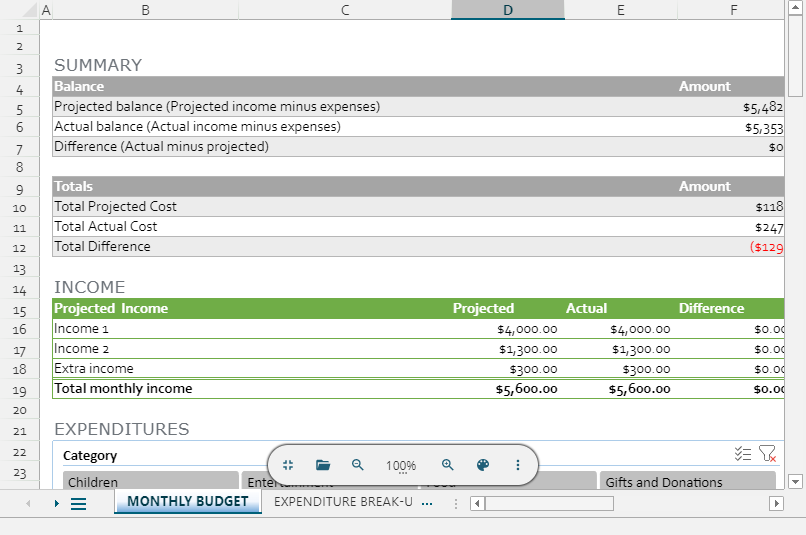
The following table lists all the toolbar buttons and their respective functions for your quick reference:
Toolbar Button Snapshot | Toolbar Button Name | Toolbar Button Function |
|---|---|---|
| Displays the Select Data File dialog where you can select a new data file of XLSX, CSV, ARROW, PARQUET, and SpreadJS (SSJSON and .sjs) data formats, to be opened along with various data options respective to each of these formats. | |
| Lets you zoom-in and zoom-out the data files using buttons or by setting the predefined zoom percentage through Zoom Mode dropdown. | |
| Hides toolbar ribbon on the top to display data viewer in full screen mode. You can switch back to original mode by clicking the icon which gets displayed in the mini-toolbar. | |
| Themes (Cycle through available themes) | Changes the theme of the DsDataViewer control while cycling through the predefined themes on every click. Currently, DsDataViewer supports six themes. |
| Shows or hides all the notes in the spreadsheet. | |
| Sorts or filters a large group of data to make it easy to read. | |
| About (About the Document Solutions Data Viewer) | Displays a pop-up box which provides version and licensing information about DsDataViewer. |




Note: The toolbar layout can be customized to hide or reorder the buttons for the three view modes: default (desktop), mobile, and full screen. For more information, see Customize Toolbar.
The following sections elaborate on the toolbar operations:
Open Document
DsDataViewer lets you open various file formats such as XLSX, CSV, ARROW, PARQUET, and SpreadJS (SSJSON and .sjs). The control provides a user-friendly interface and API options to so that you can view the data files in the desired view. To know more about opening a document in DsDataViewer, see Load File.
Zoom
DsDataViewer lets you zoom-in or zoom-out the opened data file. When working on client-side, user can either use the Zoom In( ) or Zoom Out(
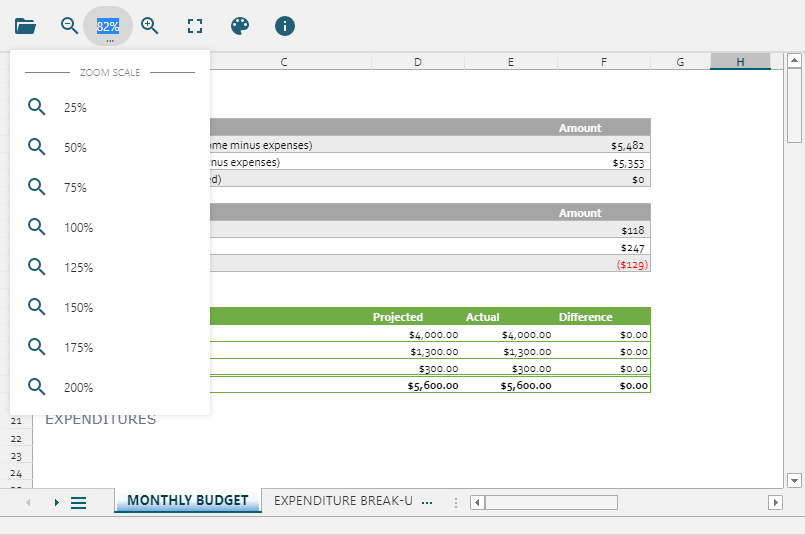
 ) buttons or can set using the Zoom Scale dropdown. User can specify the zoom scale in numeric by selecting from the Zoom Scale dropdown or by entering a custom value. The dropdown shows values from 25 percent to 200 percent with the interval of 25 between each of them. However, by typing in the Zoom Scale dropdown, user can set zoom percentage to any integer value between 25 and 400. That is, user can view a file at a minimum zoom value of 25 percent and a maximum zoom value of 400 percent.
Toggle FullScreen
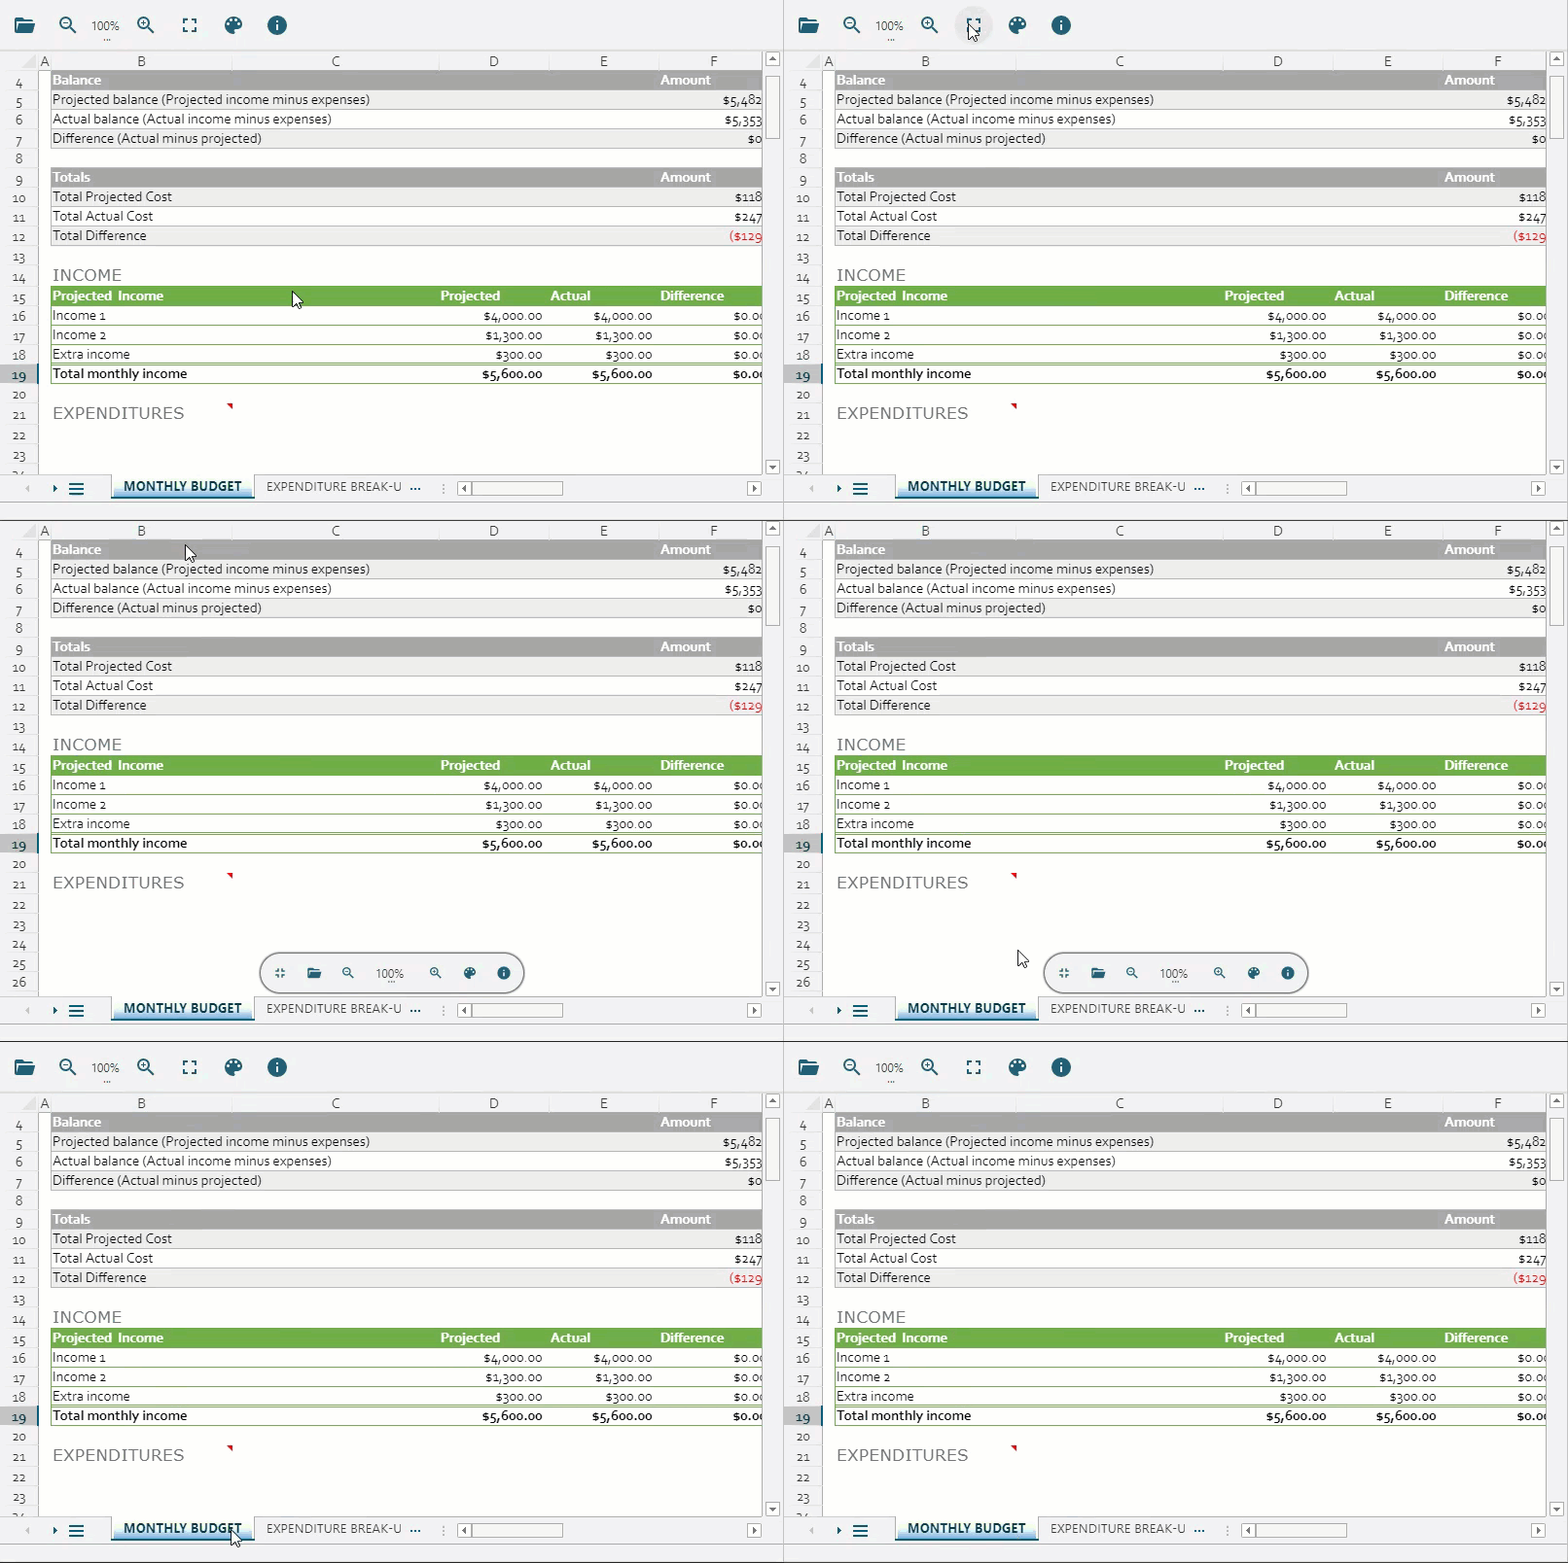
DsDataViewer lets you display data viewer in full screen at runtime as well as through code. By clicking Toggle Fullscreen button ( ) in the toolbar, user can hide toolbar ribbon on the top, display data viewer in full view, and a mini-toolbar gets displayed towards the bottom. You can switch back to original mode by clicking the icon() which gets displayed in the mini-toolbar.
Themes
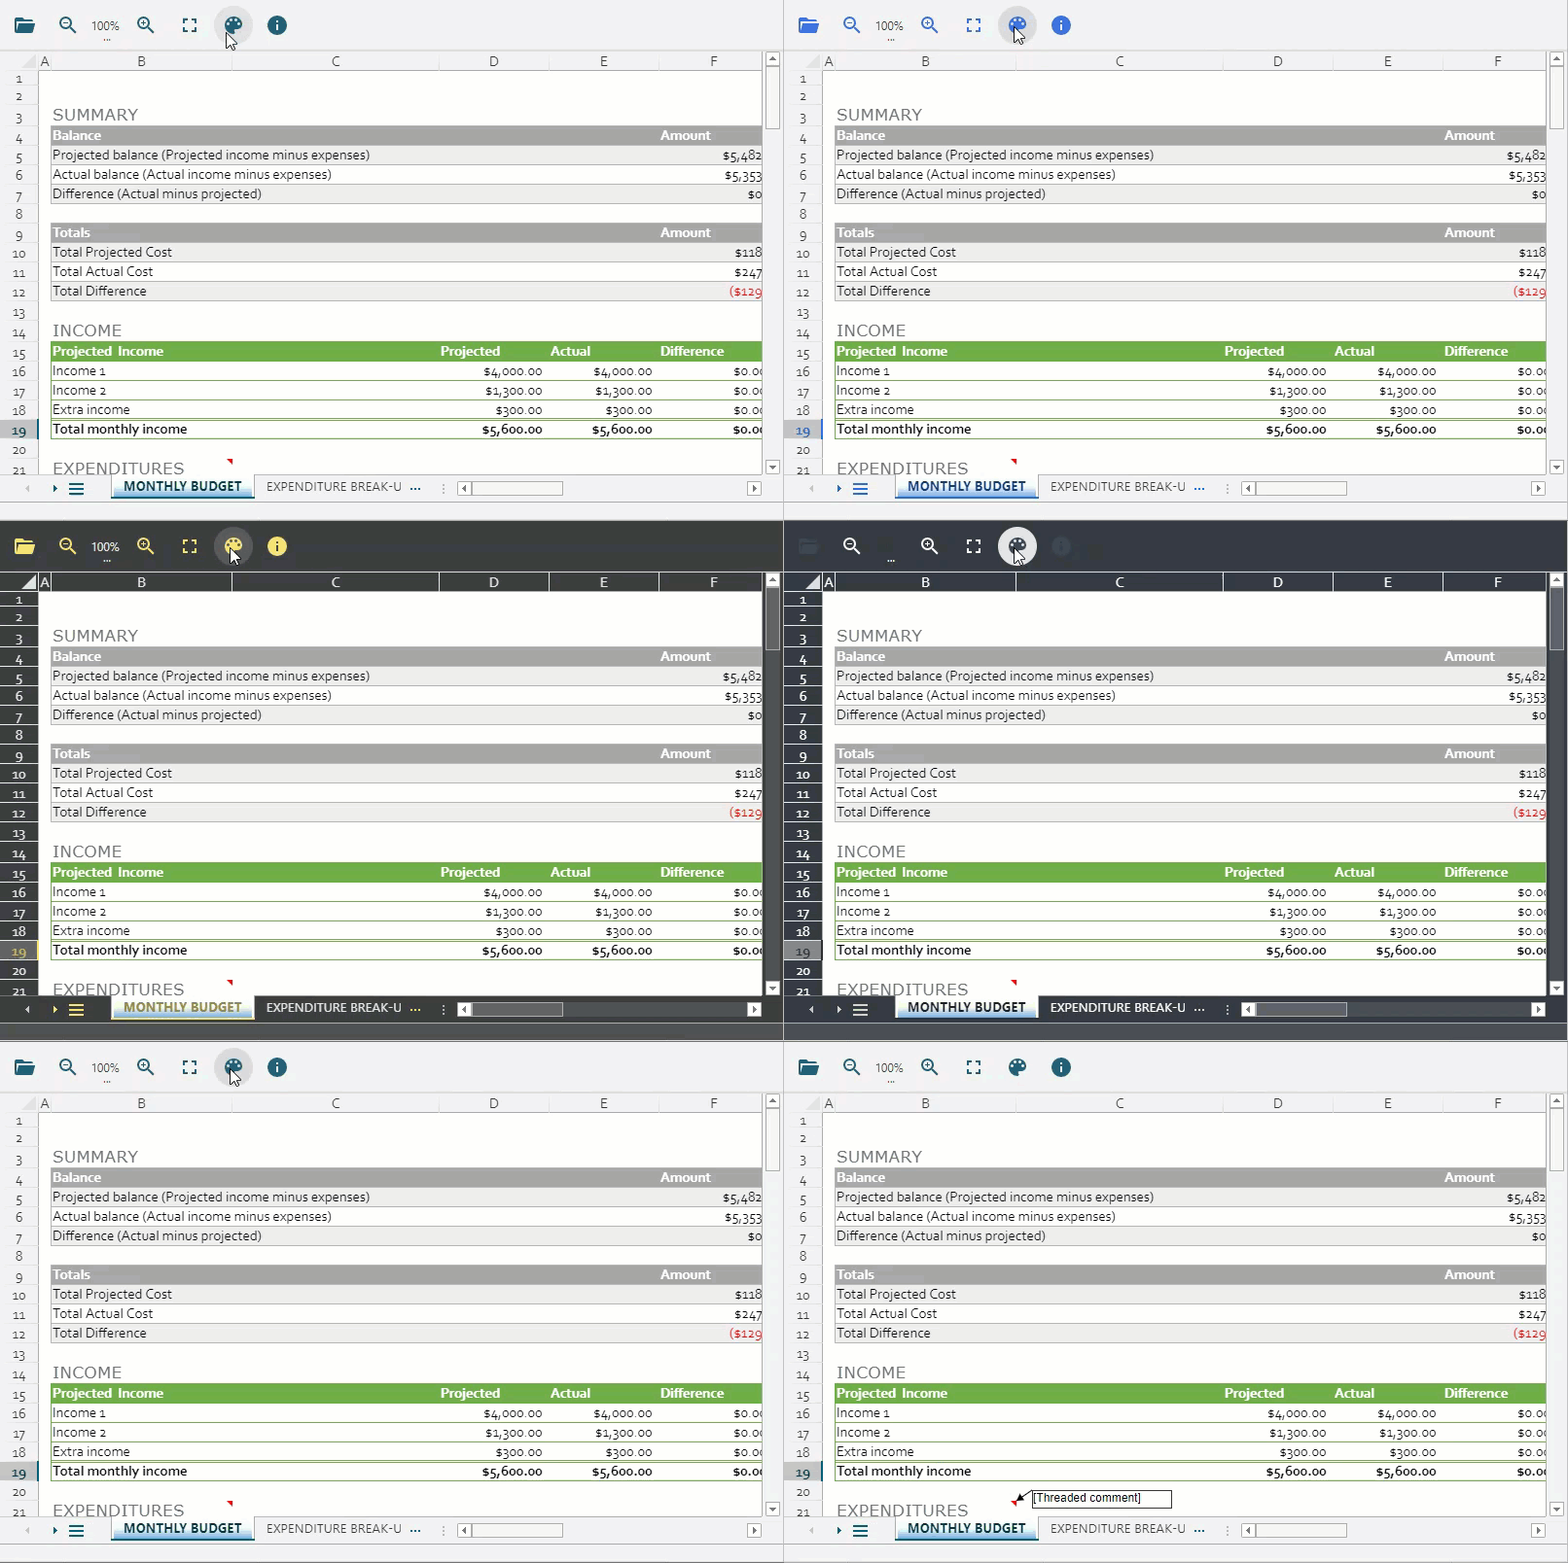
DsDataViewer provides six pre-defined themes, so that you can choose the most suitable ones matching to your application interface. You can cycle through the available themes by clicking the theme ( ) button on the toolbar. These pre-defined themes are located in the "themes" folder of the build. To be able to apply these themes successfully, the "themes" folder should be kept at the same location as that of dsdataviewer.js file.
Show/Hide Notes
DsDataViewer lets you show or hide all the notes in the spreadsheet (XLSX and SpreadJS (SSJSON and .sjs)) with one button click. The Show/Hide Notes toggle button ( ) displays all the notes in a spreadsheet if all of the notes are hidden, or it hides all the notes if they are set to always display. If a few of the notes are hidden and a few are set to always display, on the first click, the button hides the notes that were set to always display. On a second click, the button displays all the notes.
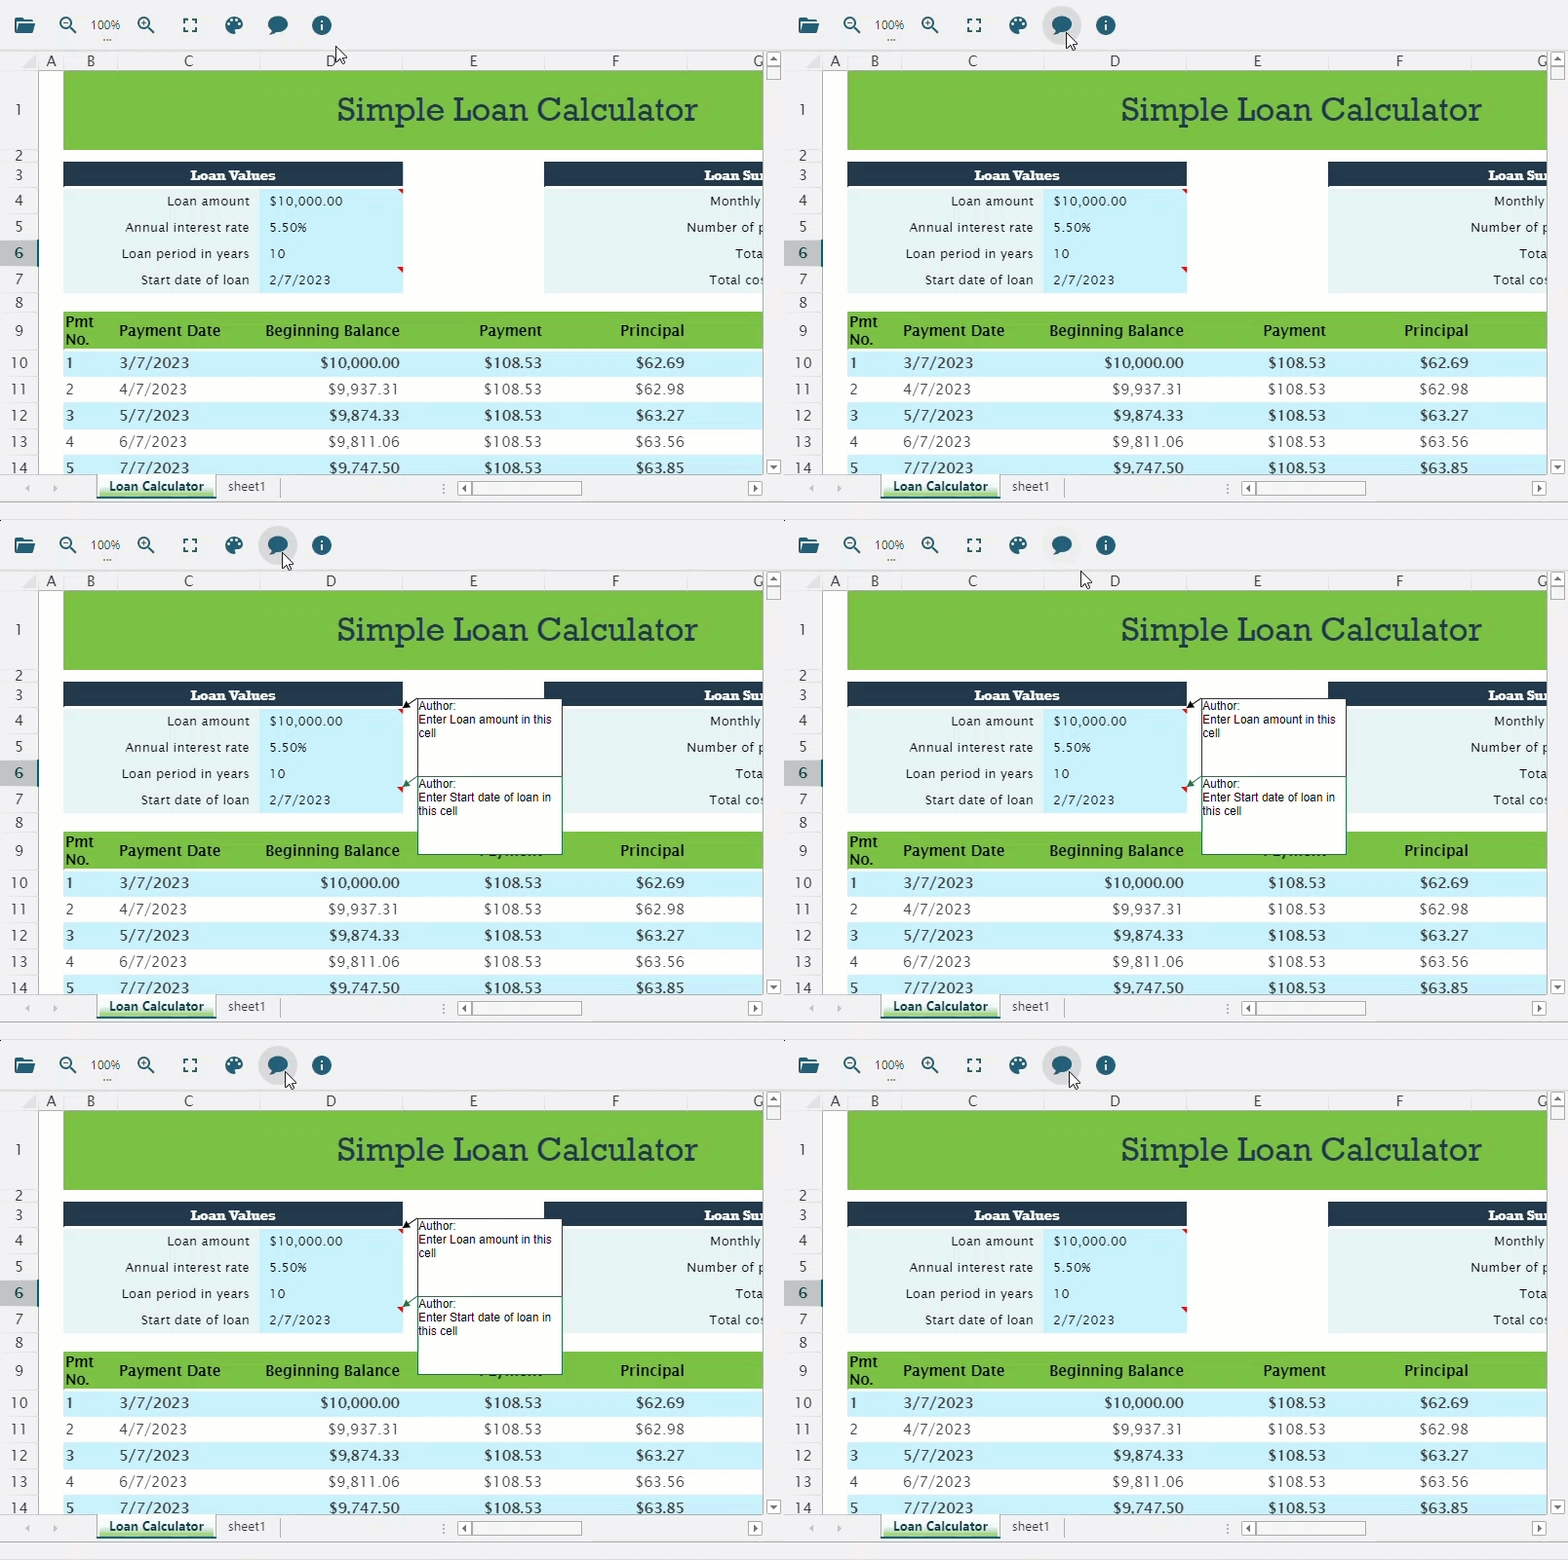
Note: The Show/Hide Notes toggle button will not be displayed on the toolbar in the following cases, even after customizing the toolbar to display the button:
DsDataViewer doesn't have any open files.
The file that was opened is in CSV format. CSV format files do not contain notes.
The file doesn't contain any notes.
The notes are on a hidden sheet. DsDataViewer currently does not support showing or hiding sheets after the file is opened.
Sort & Filter
DsDataViewer provides Sort & Filter button ( ) in the toolbar that allows you to sort and filter a range or Table. This button is supported with the Professional License of DsDataViewer. When you click on the Sort & Filter button, a drop-down menu opens that contains four options:
Sort A to Z or Sort Smallest to Largest: Sorts the data in ascending order.
Sort Z to A or Sort Largest to Smallest: Sorts the data in descending order.
The names of the options Sort A to Z and Sort Z to A will change to Sort Smallest to Largest and Sort Largest to Smallest, respectively, according to the first cell of the selected range, whether it contains a number, null or empty, date or text.
Filter: Toggles (adds and removes) the Filter icon in a selected range or Table. Click the Filter icon to open the Filter dialog.
In the XLSX, ARROW, PARQUET, or SpreadJS (SSJSON and .sjs) file, the Filter icon will be added to the row before the selected range and to the header row of the selected Table. And the icon is removed from the sheet when a range is selected, except for the Tables (and vice versa).
In CSV, the Filter icon is always added or removed from the header row in the grid decorator for all columns.
Clear Filter: Clears all filters (except sort state) in a Table or sheet. If the first cell of the selected range is included in the Table, the Table filter state will be cleared; otherwise, the sheet filter state is cleared.
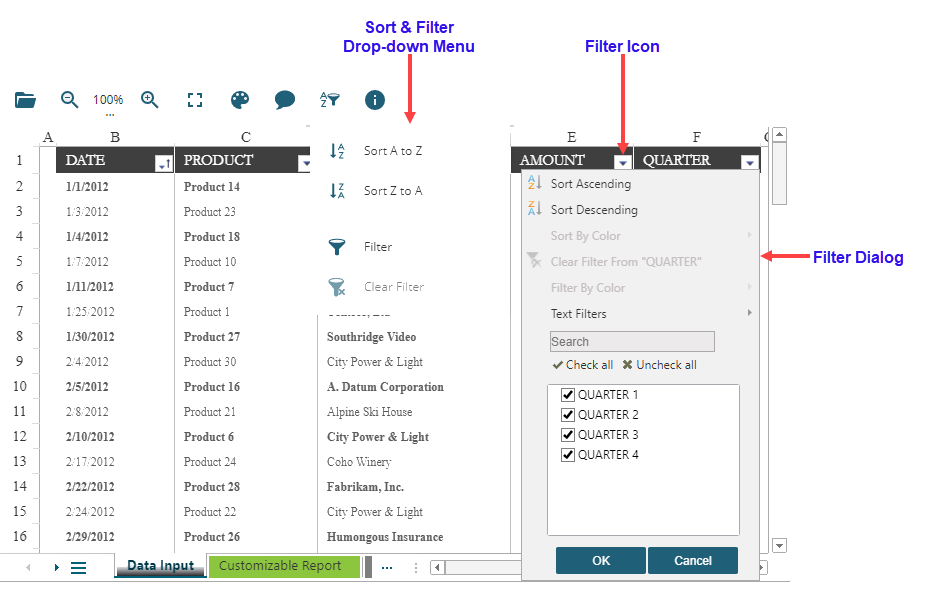
The Sort & Filter button is enabled when the selected range can be sorted, filtered, or filters are cleared. However, the Sort & Filter button will appear disabled when the selected range contains the intersection of a range and a Table and the intersection has either of the following cases:
There is no filter state to clear (either in the Table or sheet) or
The Table has filtered data, but the first cell of the selection is included in the range; or
The range has filtered data, but the first cell of the selection is included in the Table.
Also, the button appears disabled in a sheet protected for Sort and Auto Filter.
Similarly, the Sort & Filter drop-down menu options are also disabled in certain cases that are described in the following table:
Options | Cases |
|---|---|
Sort A to Z or Sort Smallest to Largest | The selected range and Table intersect, and either of them is showing filtered data, or the opened file is a CSV file. In a CSV file, the sort operation needs to be done through the Filter dialog. |
Sort Z to A or Sort Largest to Smallest | The selected range and Table intersect, and either of them is showing filtered data, or the opened file is a CSV file. In a CSV file, the sort operation needs to be done through the Filter dialog. |
Filter | “Show Filter(s)“ data option in the Open dialog is unchecked, or the selected range and Table intersect, and either of them is showing filtered data. |
Clear Filter | No filter is applied to the Table or sheet, or “Show Filter(s)“ data option in the Open dialog is unchecked. |
For more information on how to use these options for sorting and filtering a range or Table, see Sorting and Filtering.
About
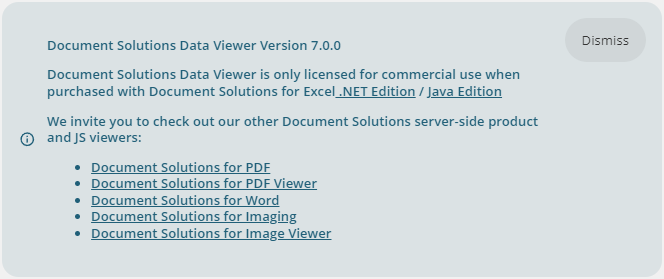
The About button( ) on the toolbar lets you display information related to the control and its version in the form of a pop-up shown below.
Sidebar
DsDataViewer sidebar provides a search button on the left side that lets you perform search operations on the viewer.

DsDataViewer also allows you to expand the sidebar by clicking on the Expand menu ( ) button.

The following table lists the sidebar button and its respective function for your quick reference:
Sidebar Button Snapshot | Sidebar Button Name | Sidebar Button Function |
|---|---|---|
| Allows you to search for data in a workbook on the current sheet or across the sheet. It also provides options to customize the search. |
Note: The sidebar can be customized to hide the sidebar or hide the button. For more information, see Customize Sidebar.
The following section elaborates on the sidebar operations:
Search Panel
DsDataViewer provides Search Panel ( ) to search for data in a workbook on the current sheet or across the sheet. Search Panel provides FindWhat field, Within option to choose between Current Sheet or All Sheets, a few advance options such as Match Case, Match Exactly, and Use Wildcards, and generates a query details table that will include sheet name, cell position, and value, allowing a user to quickly jump to the cell by clicking on the result.
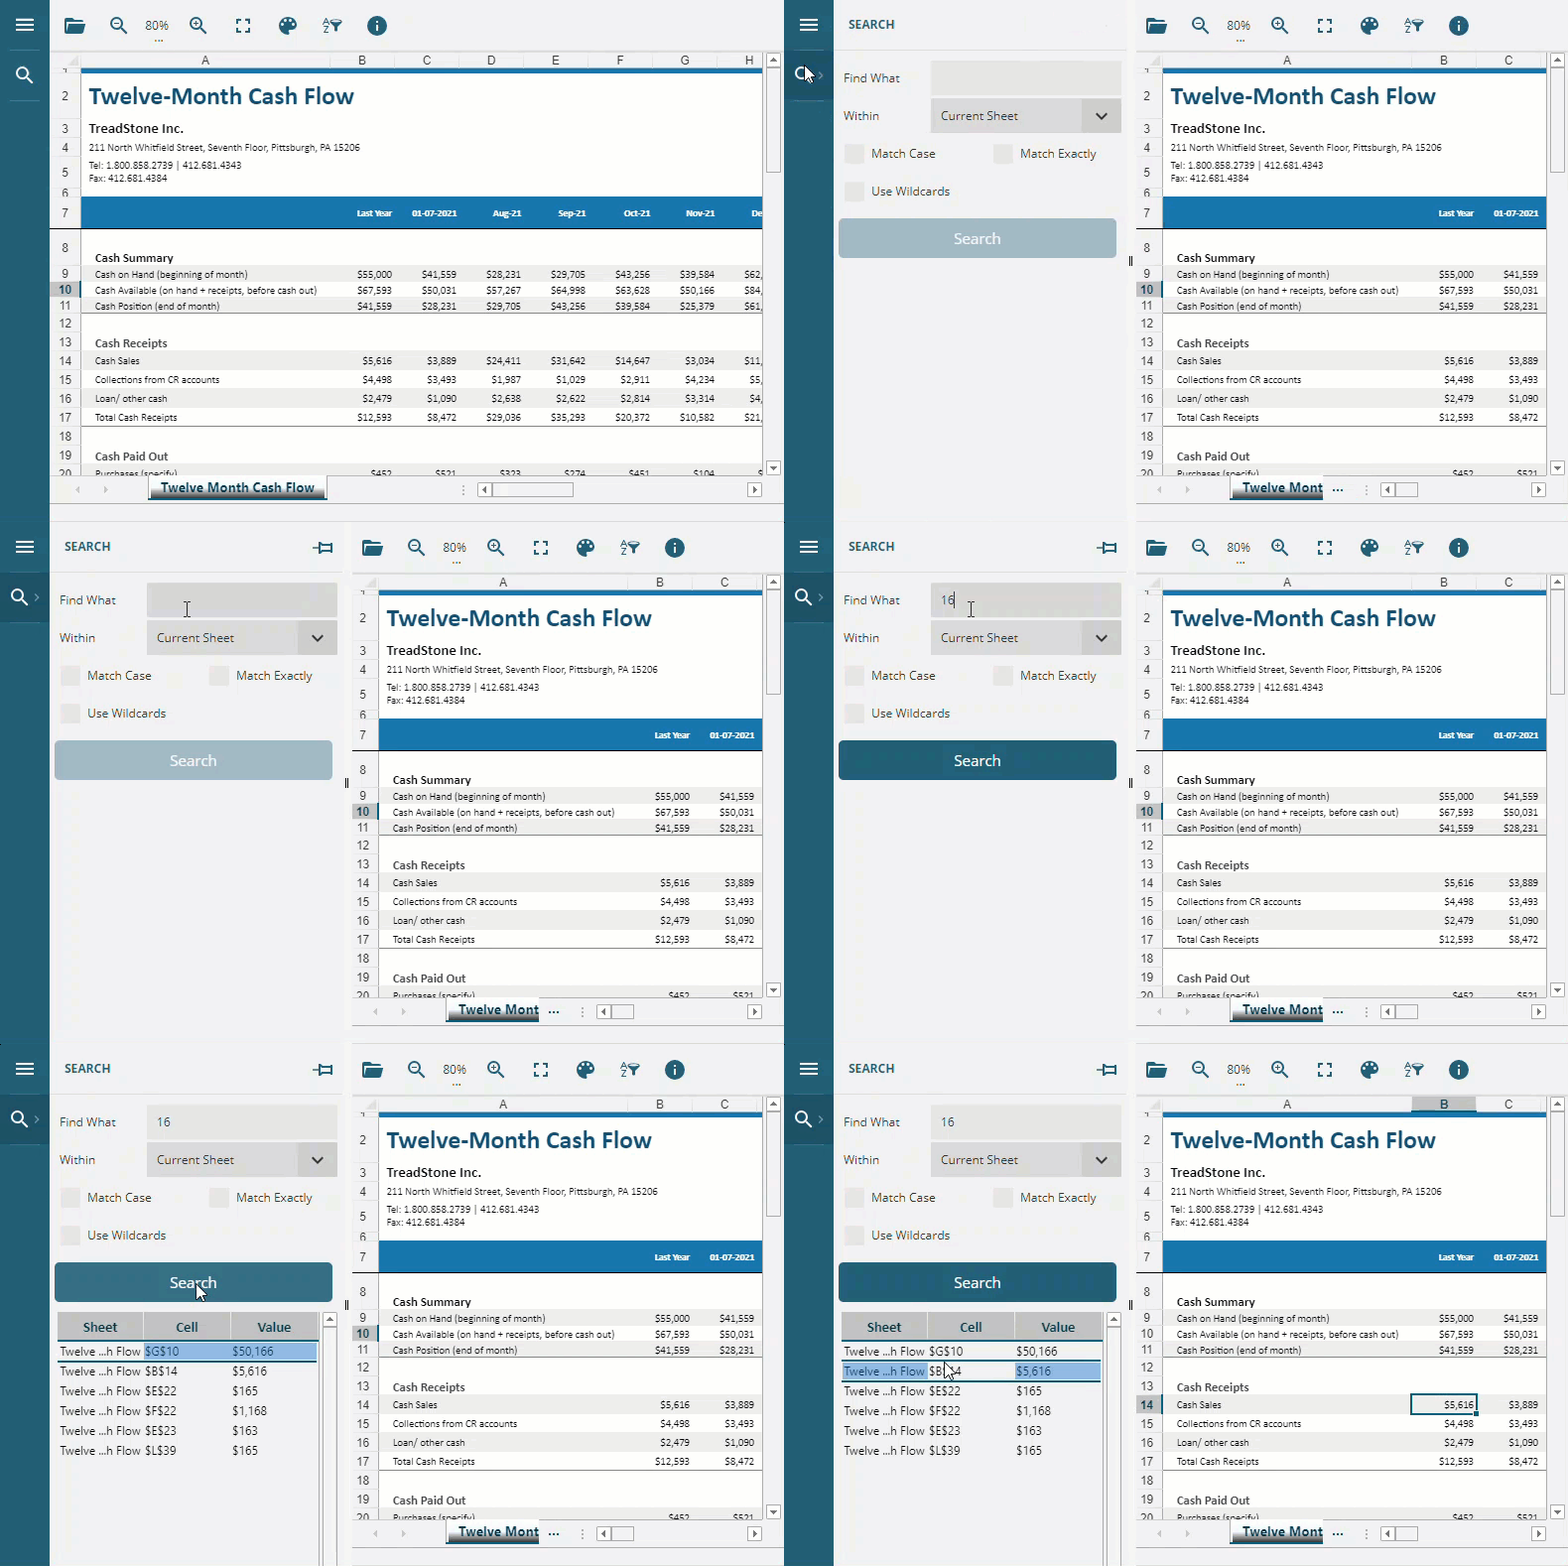
For more information on how to use Search Panel and its options, see Search Data.
Data Display Area
Data display area of the DsDataViewer control gives you an excel-like experience with grid, sheet tabs, and other elements to support various data features.
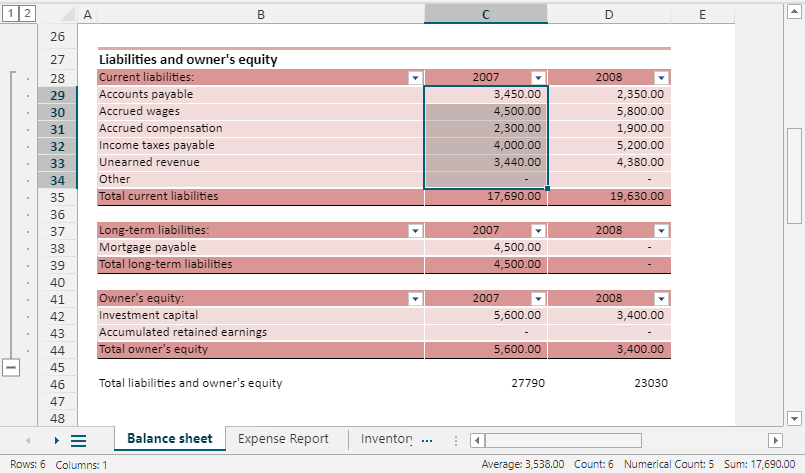
The following table lists all the components of data display area with their respective functions:
Data Display Area Component Snapshot | Data Display Area Component Name | Data Display Area Component Function |
|---|---|---|
| Grid | Indicates the area that holds data arranged in rows and columns. |
| Sheet Tabs | Lets you switch between different worksheets of the file. When all sheet names do not fit in the available tabstrip area, navigation arrow buttons( |
| Allows you to view grid area beyond the visible area by scrolling horizontally and vertically. | |
| Represents outlines of the grouped rows or columns and are displayed on left or top of the grid respectively. | |
| Displays information about the selected range. Shows row and columns count on the left and aggregation information such as sum, average, and cell count on the right. |
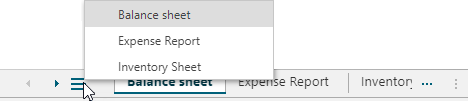
 ) are enabled to navigate between the sheets tabs. Also, there is a hamburger button(
 ) on the tabstrip that displays a list of all sheets in the file to directly navigate to the required sheet tab.


