GanttView Elements
The GanttView control provides an interactive UI to display the complete project lifecycle. It comprises two major elements, a grid and a chart, separated by a draggable splitter. The grid and the chart remain in sync with each other. If you make any changes in the task within the grid, the same gets reflected in the chart.
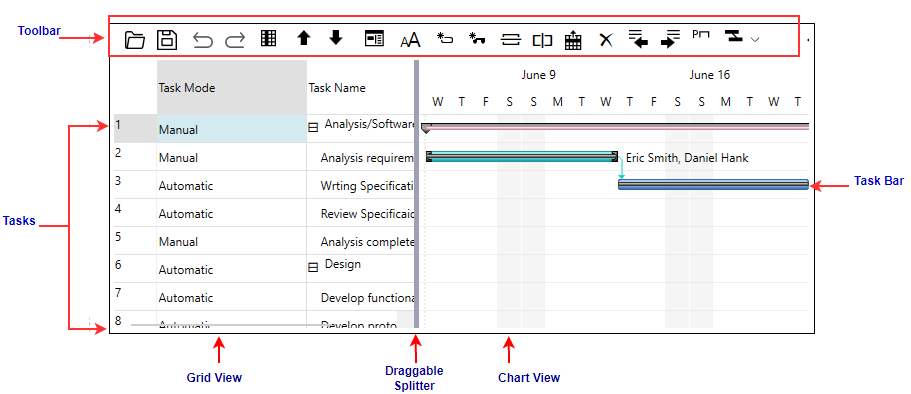
The following image displays how the GanttView control presents various project-related attributes, such as task/activity name, mode, duration, etc.

Each element of the GanttView control is described below:
- Grid View: The grid displays various attributes pertaining to a particular task/activity. You can edit these attributes through the grid.
- Chart View: The chart provides visual representation of the task details presented on the grid. These details are presented through bars on the chart.
- Splitter: The draggable splitter divides the chart and grid.
- Task: Each task/activity is represented by a bar whose position and length indicate the start date, end date, and task duration.
- Timescale: GanttView displays a timescale along a horizontal timeline, which comprises three tiers, namely top, bottom, and middle.
- Toolbar: The toolbar provides quick access to various operations that can be performed in GanttView. For more information on Toolbar, see GanttView Toolbar.


