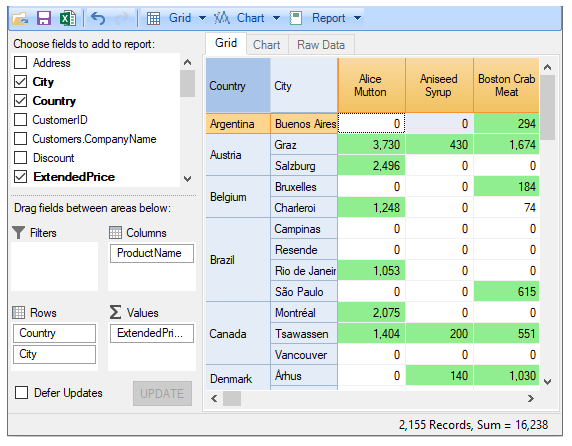
Conditional formatting enables users to highlight cells with a certain color, depending upon the cell's value. The FlexPivotGrid control lets users apply conditional formatting to an individual cell or a range of cells to let them visualize data more clearly for analysis and comparison. The C1FlexPivotGrid class extends this functionality from the OwnerDraw feature of C1FlexGrid.
Let's say a user wants to analyze the variation in Extended Price of products on the basis of Geography, that is City and Country. The user wants to know the cities in which the Extended Price of the product is less than 100 so that he/she can make price adjustments in future. In such a case, the user can apply conditional formatting to highlight and compare Extended Price.
The image given below shows a FlexPivotGrid highlighting Extended prices greater than 100 and segregated by Product, Country and City.

Complete the following steps for applying conditional formatting to C1FlexPivotGrid. This implementation uses the sample created in Binding FlexPivot to Data Source in Code topic.