
Summary
Summarizing data is one of the most important features of the grid where you can easily group the similar data and calculate various types of aggregates such as Sum, Average, Count, Max, Min, and more.
In FlexGrid, you can easily summarize data by using SubTotal method of the C1FlexGrid class. It adds subtotal rows that contain aggregate data for the regular (non-subtotal) rows and also supports the hierarchical aggregates. The method has various overloads which gives you enough flexibility to deal with multiple summarizing related scenarios. All these overloads have one parameter in common, that is AggregateEnum which lets you set the type of aggregate you want to implement. Other parameters in various overloads let you set the outline level, start and end column, and column that contains values to be aggregated.
Create Subtotals
Below example demonstrates the use of SubTotal method in the WinForms FlexGrid for calculation of average aggregate based on Score column:
// Clears any existing subtotal(s) present in grid
c1FlexGrid1.Subtotal(AggregateEnum.Clear);
// Adds subtotal in grid with Level: 1, Group: 'Course' column, Aggregate(Average): Score,  Attendance
c1FlexGrid1.Subtotal(AggregateEnum.Average, 1, 3, 3, 4, "Average for {0}");
' Clears any existing subtotal(s) present in grid
c1FlexGrid1.Subtotal(AggregateEnum.Clear)
' Adds subtotal in grid with Level: 1, Group: 'Course' column, Aggregate(Average): Score, Attendance
c1FlexGrid1.Subtotal(AggregateEnum.Average, 1, 3, 3, 4, "Average for {0}") Style Subtotals
When the Subtotal method adds the rows with the aggregate information, it automatically assigns in-built subtotal styles to the new rows. You can customize the appearance of the subtotal rows by changing the properties of the outline styles in the designer with the Style Editor or using the code. Below example demonstrates styling of subtotals at three levels in the WinForms FlexGrid.
// Styles subtotals at level 0
CellStyle s = c1FlexGrid1.Styles[CellStyleEnum.Subtotal0];
s.BackColor = Color.Black;
s.ForeColor = Color.White;
s.Font = new Font(c1FlexGrid1.Font, FontStyle.Bold);
// Styles subtotals at level 1
s = c1FlexGrid1.Styles[CellStyleEnum.Subtotal1];
s.BackColor = Color.DarkBlue;
s.ForeColor = Color.White;
// Styles subtotals at level 2
s = c1FlexGrid1.Styles[CellStyleEnum.Subtotal2];
s.BackColor = Color.DarkRed;
s.ForeColor = Color.White;
c1FlexGrid1.AutoSizeCols();
Dim s As CellStyle = c1FlexGrid1.Styles(CellStyleEnum.Subtotal0)
s.BackColor = Color.Black
s.ForeColor = Color.White
s.Font = New Font(c1FlexGrid1.Font, FontStyle.Bold)
s = c1FlexGrid1.Styles(CellStyleEnum.Subtotal1)
s.BackColor = Color.DarkBlue
s.ForeColor = Color.White
s = c1FlexGrid1.Styles(CellStyleEnum.Subtotal2)
s.BackColor = Color.DarkRed
s.ForeColor = Color.White
c1FlexGrid1.AutoSizeCols() Customize Subtotals
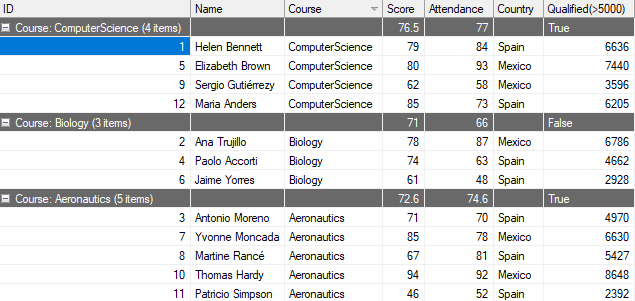
FlexGrid, in addition to built-in aggregate options, lets you create custom expressions in bound mode and use them as subtotals in groups along with aggregates. You can specify the custom expressions for a column using GroupExpression property of the Column class. Below example demonstrates how to create a custom expression as a subtotal for Qualified column of the WinForms FlexGrid.
public void CustomizeSubTotal(C1FlexGrid c1FlexGrid1)
{
  List<GroupDescription> grps = new List<GroupDescription>();
  //Creates a group for column 'Course'
  GroupDescription grp = new GroupDescription("Course", ListSortDirection.Descending, true);
  grps.Add(grp);
  //Groups FlexGrid according to above group
  c1FlexGrid1.GroupDescriptions = grps;
  //Adds a new column in FlexGrid with custom calculation expression
  var column = c1FlexGrid1.Cols.Add();
  column.Name = "Qualified";
  column.DataType = typeof(object);
  column.Caption = "Qualified(>5000)";
  column.AllowEditing = false;
  column.Expression = "[Attendance] * [Score]";
  //GroupExpression implementation
  c1FlexGrid1.Cols["Score"].GroupExpression = "=Average([Score])";
  c1FlexGrid1.Cols["Attendance"].GroupExpression = "=Average([Attendance])";
  c1FlexGrid1.Cols["Qualified"].GroupExpression = "=iif(Average([Score]*[Attendance])<5000,false,true)";
  c1FlexGrid1.AutoSizeCols();
}
Public Sub CustomizeSubTotal(ByVal c1FlexGrid1 As C1FlexGrid)
Dim grps As List(Of GroupDescription) = New List(Of GroupDescription)()
'Creates a group for column 'Course'
Dim grp As GroupDescription = New GroupDescription("Course", ListSortDirection.Descending, True)
grps.Add(grp)
'Groups FlexGrid according to above group
c1FlexGrid1.GroupDescriptions = grps
'Adds a new column in FlexGrid with custom calculation expression
Dim column = c1FlexGrid1.Cols.Add()
column.Name = "Qualified"
column.DataType = GetType(Object)
column.Caption = "Qualified(>5000)"
column.AllowEditing = False
column.Expression = "[Attendance] * [Score]"
'GroupExpression implementation
c1FlexGrid1.Cols("Score").GroupExpression = "=Average([Score])"
c1FlexGrid1.Cols("Attendance").GroupExpression = "=Average([Attendance])"
c1FlexGrid1.Cols("Qualified").GroupExpression = "=iif(Average([Score]*[Attendance])<5000,false,true)"
c1FlexGrid1.AutoSizeCols()
End Sub See Also
Documentation
Blog