
- Spread for WPF Overview
- About the Product
- Getting Started
- Quick Start
- Designer
- Features
- Assembly Reference
Create and Use Visual Functions
Spread WPF provides support for working with data visualization functions in the spreadsheet. A data visualization function is similar to a custom function for calculation, but also provides additional interfaces for painting custom visualization inside the cell. This feature enables implementing advanced sparklines and other custom cell-level visualizations.
All data visualization functions must use or inherit from the VisualFunction class, which provides the core implementation to operate with the calculation engine and the UI layer.
A data visualization function allows users to inject custom logic to create a visual in a cell, and can be used in a formula like a custom function.
All data visualization functions consist of two parts:
VisualFunction — The function class that registers with the calculation engine
FunctionVisualizer — The visualizer class that implements the painting logic
The IsVisual Property
The IsVisual property of the FunctionVisualizer class determines how the visualization function behaves.
true (default): The function renders custom visual elements inside the cell by overriding PaintContent and/or PaintBackground.
false: The function applies style formatting logic through the ApplyFormat method instead of rendering custom visuals.
The IsShowCell Property
The IsShowCell property controls whether the original cell content is displayed.
Returns false when the cell value is of type
VisualizationData.Returns true for all other cell value types.
The IsShowCell property is ignored when IsVisual is set to false.
Create a Data Visualization Function
To create a data visualization function:
Create a class that inherits from FunctionVisualizer.
Override PaintContent and/or PaintBackground to provide custom WPF visual elements.
Optionally override:
IsShowCell to control whether the original cell content is displayed.
IsVisual to switch between visual painting and style formatting.
ApplyFormat when IsVisual is set to false.
Create a VisualFunction instance and register it using AddCustomFunction.
The PaintContent and PaintBackground methods must return a UIElement to render inside the cell. If you return null, no custom visual is rendered.
The following example paints a colored border around a cell that contains an error. The border color can be specified using the second function parameter.
C#
public class ErrorFunctionVisualizer : GrapeCity.Wpf.SpreadSheet.FunctionVisualizer
{
    protected override UIElement PaintContent(PaintingContext paintingContext, int row, int column, CellData celldata)
    {
        if (celldata.Value is GrapeCity.CalcEngine.VisualizationData visualizationData)
        {
            var context = paintingContext.Workbook.WorkbookSet.CalculationEngine.EvaluationContext;
            if (context != null && visualizationData.Value.ValueType == GrapeCity.CalcEngine.ValueType.Error)
            {
                var colorString = visualizationData.Parameters[1].GetText(context);
                var color = (System.Windows.Media.Color)ColorConverter.ConvertFromString(colorString);
                var solidColorBrush = new SolidColorBrush(color);
                return new System.Windows.Controls.Border
                {
                    BorderBrush = solidColorBrush,
                    BorderThickness = new Thickness(1),
                    Background = Brushes.Transparent,
                    IsHitTestVisible = false,
                    SnapsToDevicePixels = true
                };
            }
            else if (celldata.Value is GrapeCity.CalcEngine.CalcError)
            {
                return new System.Windows.Controls.Border
                {
                    BorderBrush = Brushes.Red,
                    BorderThickness = new Thickness(1),
                    Background = Brushes.Transparent,
                    IsHitTestVisible = false,
                    SnapsToDevicePixels = true
                };
            }
        }
        return null;
    }
}
VB
Public Class ErrorFunctionVisualizer
    Inherits GrapeCity.Wpf.SpreadSheet.FunctionVisualizer
    Protected Overrides Function PaintContent(
        paintingContext As PaintingContext,
        row As Integer,
        column As Integer,
        celldata As CellData) As UIElement
        If TypeOf celldata.Value Is GrapeCity.CalcEngine.VisualizationData Then
            Dim visualizationData =
                DirectCast(celldata.Value, GrapeCity.CalcEngine.VisualizationData)
            Dim context = paintingContext.Workbook.WorkbookSet.
                CalculationEngine.EvaluationContext
            If context IsNot Nothing AndAlso
               visualizationData.Value.ValueType =
                   GrapeCity.CalcEngine.ValueType.[Error] Then
                Dim colorString =
                    visualizationData.Parameters(1).GetText(context)
                Dim color =
                    CType(ColorConverter.ConvertFromString(colorString),
                          System.Windows.Media.Color)
                Dim solidColorBrush As New SolidColorBrush(color)
                Return New System.Windows.Controls.Border With {
                    .BorderBrush = solidColorBrush,
                    .BorderThickness = New Thickness(1),
                    .Background = Brushes.Transparent,
                    .IsHitTestVisible = False,
                    .SnapsToDevicePixels = True
                }
            ElseIf TypeOf celldata.Value Is GrapeCity.CalcEngine.CalcError Then
                Return New System.Windows.Controls.Border With {
                    .BorderBrush = Brushes.Red,
                    .BorderThickness = New Thickness(1),
                    .Background = Brushes.Transparent,
                    .IsHitTestVisible = False,
                    .SnapsToDevicePixels = True
                }
            End If
        End If
        Return Nothing
    End Function
End Class
Use a Data Visualization Function
To use a data visualization function in a formula:
1. Assign any function name to the VisualFunction.
2. Prefix the function name with "VF." when using it in a formula.
Note: The "VF." prefix is required for all data visualization functions in formulas.
C#
private void DataVisualizationFunction_Load(object sender, RoutedEventArgs e)
{
// Register the visual function
spreadSheet1.AddCustomFunction(new VisualFunction("ERROR", 1, 2, FunctionAttributes.Variant, new ErrorFunctionVisualizer()));
// Provide a color reference
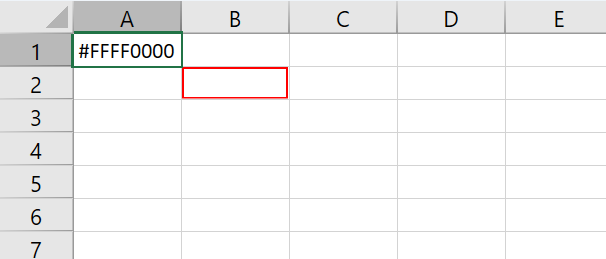
spreadSheet1.Workbook.ActiveSheet.Cells["A1"].Value = System.Windows.Media.Colors.Red.ToString();
// Use the function in a formula
spreadSheet1.Workbook.ActiveSheet.Cells["B2"].Formula = "VF.ERROR(1/0, A1)";
}VB
Private Sub DataVisualizationFunction_Load(sender As Object, e As RoutedEventArgs)
    ' Register the visual function
    spreadSheet1.AddCustomFunction(
    New VisualFunction(
        "ERROR",
        1,
        2,
        FunctionAttributes.Variant,
        New ErrorFunctionVisualizer()))
    ' Provide a color reference
    spreadSheet1.Workbook.ActiveSheet.Cells("A1").Value =
        System.Windows.Media.Colors.Red.ToString()
    ' Use the function in a formula
    spreadSheet1.Workbook.ActiveSheet.Cells("B2").Formula =
        "VF.ERROR(1/0, A1)"

End Sub