
- SpreadJS Overview
- Getting Started
- JavaScript Frameworks
- Best Practices
-
Features
- Workbook
- Worksheet
- Rows and Columns
- Headers
- Cells
- Data Binding
- Data Manager
- TableSheet
- GanttSheet
- ReportSheet
- Data Charts
- JSON Schema with SpreadJS
- SpreadJS File Format
- Data Validation
- Conditional Formatting
- Sort
- Group
- Formulas
- What-If Analysis
- Serialization
- Keyboard Actions
- Shapes
- Floating Objects
- Barcodes
- Charts
- Sparklines
- Tables
- Pivot Table
- Slicer
- Theme
- User Management
- Culture
- AI Assistant
- SpreadJS Designer
- SpreadJS Designer VSCode Plugin
- Tutorials
- SpreadJS Designer Component
- SpreadJS Collaboration Server
- Touch Support
- Formula Reference
- Import and Export Reference
- Events
- API Documentation
- Release Notes
Input and Result Rules
This topic supplements the SJS.TABLE function by explaining how the output array dimensions are determined and how input values are mapped to each simulation position.
It focuses specifically on:
How the size of the spilled result is calculated
How many simulations are performed
Which input values are selected for each simulation
How mismatched input dimensions are handled
These rules apply when working with non-standard result_reference shapes or when combining multiple inputs of different sizes.
Dimension Overview
The following table summarizes how the shape of result_reference affects the result size and simulation behavior.
result_reference Shape | Output Size | Simulation Count | Input Usage |
|---|---|---|---|
Multi-cell range | Same as | 1 | First value only |
Single column | Preserve row count; columns = max input columns | Per column | First row of each input |
Single row | Preserve column count; rows = max input rows | Per row | First column of each input |
Single cell | Max rows × max columns across inputs | Per output cell | Full positional mapping |
Examples by Shape
Base Model (From Complete Example)
The Predict Table uses:
=SJS.TABLE(B7, C7:J7, B2, B8:B41, B1)Where:
B7→ Net Income (single-cell result_reference)C7:J7→ Discount values (1 × 8)B8:B41→ Price values (34 × 1)
This model is used to explain the dimension rules below.
All examples use:
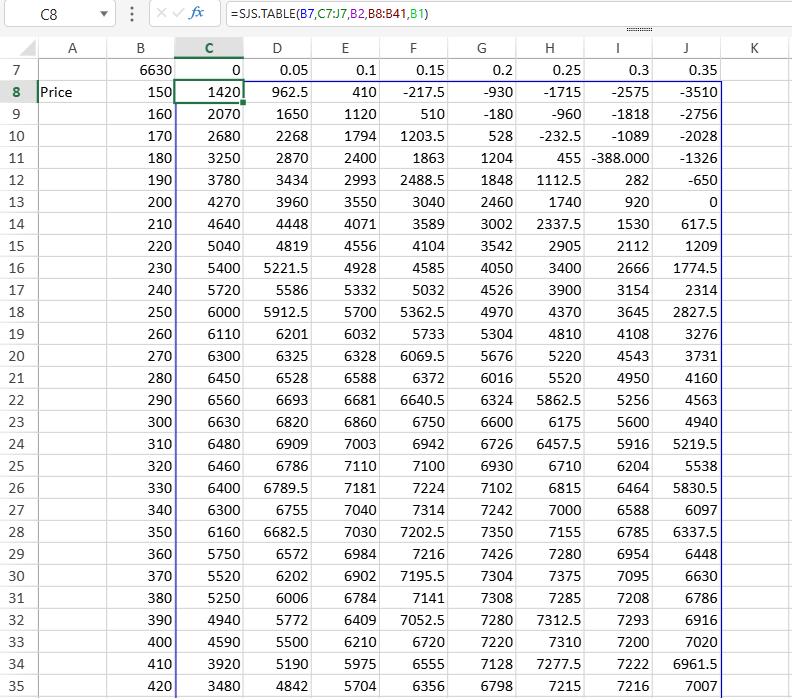
Result formula: =B1*10 + C11. Single Cell (Complete Example Case)
Formula:
=SJS.TABLE(B7, C7:J7, B2, B8:B41, B1)Shapes:
B7→ 1 × 1C7:J7→ 1 × 8B8:B41→ 34 × 1
Result size:
34 rows × 8 columnsMapping:
Each row corresponds to one Price value.
Each column corresponds to one Discount value.
Each cell recalculates Net Income using:
Price = current row value
Discount = current column value
This demonstrates full positional expansion.
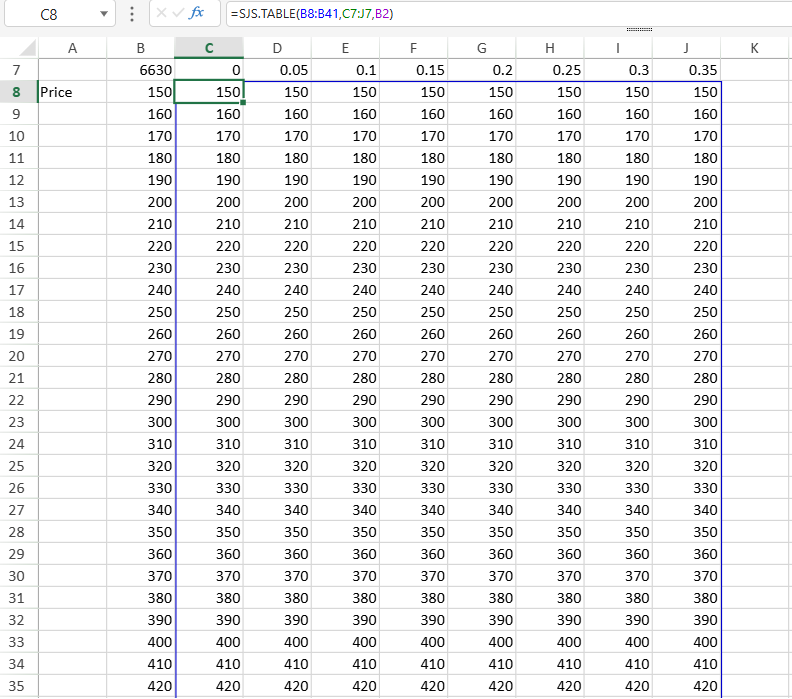
2. Single Column result_reference (Variation of Base Model)
Assume Net Income is referenced as a vertical range:
=SJS.TABLE(B8:B41, C7:J7, B2)Behavior:
Row count (34) is preserved.
Columns expand to match the 8 Discount values.
One simulation per Discount value.
Each column represents recalculation under one Discount rate.
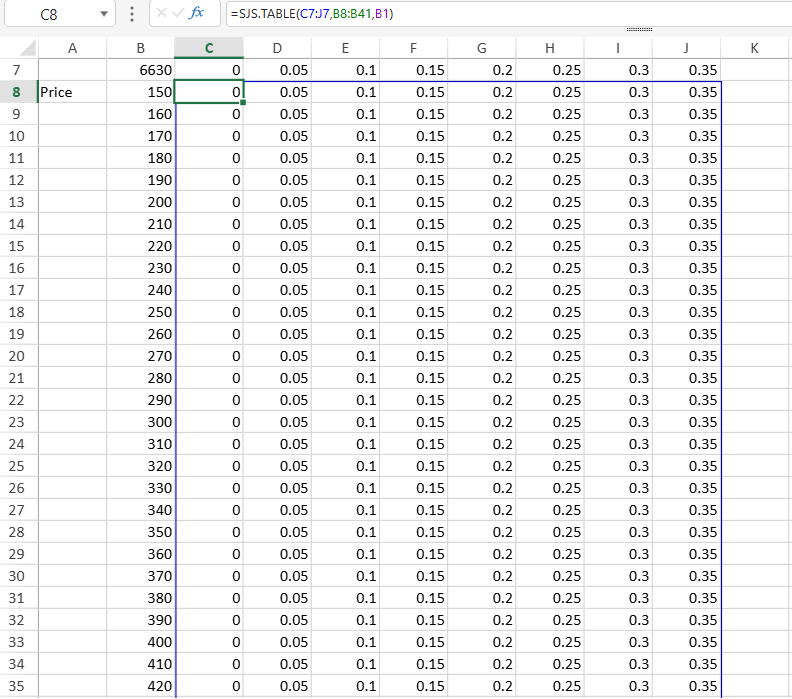
3. Single Row result_reference (Variation)
Assume a horizontal summary row:
=SJS.TABLE(C7:J7, B8:B41, B1)Behavior:
Column count (8) is preserved.
Rows expand to match 34 Price values.
One simulation per Price value.
Each row represents recalculation under one Price.
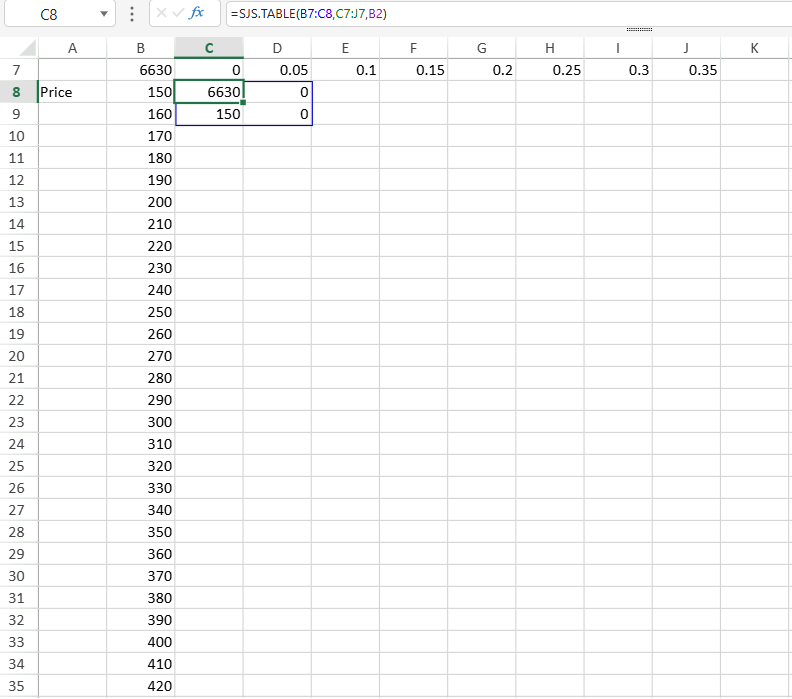
4. Multi-Cell result_reference
If a 2 × 2 result block is used:
=SJS.TABLE(B7:C8, C7:J7, B2)Behavior:
Output size remains 2 × 2.
Only the first Discount value is used.
Additional input values are ignored.
Only one simulation occurs.
This case does not produce dimensional expansion.
Matching Rules
Single-value inputs apply to all simulations.
Single-row inputs vary by column.
Single-column inputs vary by row.
Multi-row and multi-column inputs vary by both row and column.
Out-of-range positions are treated as empty, and extra input values beyond the required dimensions are ignored.