
- SpreadJS Overview
- Getting Started
- JavaScript Frameworks
- Best Practices
-
Features
- Workbook
- Worksheet
- Rows and Columns
- Headers
- Cells
- Data Binding
- Data Manager
- TableSheet
- GanttSheet
- ReportSheet
- Data Charts
- JSON Schema with SpreadJS
- SpreadJS File Format
- Data Validation
- Conditional Formatting
- Sort
- Group
- Formulas
- What-If Analysis
- Serialization
- Keyboard Actions
- Shapes
- Floating Objects
- Barcodes
- Charts
- Sparklines
- Tables
- Pivot Table
- Slicer
- Theme
- User Management
- Culture
- AI Assistant
- SpreadJS Designer
- SpreadJS Designer VSCode Plugin
- Tutorials
- SpreadJS Designer Component
- SpreadJS Collaboration Server
- Touch Support
- Formula Reference
- Import and Export Reference
- Events
- API Documentation
- Release Notes
SJS.TABLE Function
The SJS.TABLE function performs What‑If Analysis by evaluating a result cell or range against one or more sets of input values.
It returns the calculated results as a dynamic array.
The function supports one-variable and multi-variable simulations within a single formula.
Syntax
=SJS.TABLE(result_reference, inputs1, input_cell1, ...)Parameters
Parameter | Description |
|---|---|
| The cell or range to evaluate for each simulation. |
| The values to substitute into |
| The single cell reference that receives each input value during evaluation. |
Additional inputs / input_cell pairs can be supplied to perform multi-variable analysis. All pairs after the first are optional.
Behavior
SJS.TABLE evaluates result_reference and returns the collected results as a spilled dynamic array.
The result expands automatically based on the structure of the inputs.
The original values in referenced input cells are not permanently modified.
The formula behaves like any standard dynamic array formula.
Single-value inputs are applied to every simulation.
Output
SJS.TABLE returns a dynamic array whose size depends on the shape of result_reference and the supplied inputs.
A single-cell
result_referenceproduces a result grid based on the input dimensions.A range
result_referencepreserves its shape for each simulation.
When multiple input ranges are provided, input values are evaluated according to the dimension and mapping rules described in Input and Result Rules.
For detailed rules about how output size is determined and how input values are matched to each simulation, see Input and Result Rules.
Usage Patterns
The following patterns demonstrate common ways to use SJS.TABLE.
One Variable — Column Inputs
Use this pattern when input values are listed vertically and you want results to spill downward.
=SJS.TABLE(B2, A3:A10, A2)Each row returns the value of B2 evaluated with A2 set to the corresponding value in A3:A10.
One Variable — Row Inputs
Use this pattern when input values are listed horizontally and you want results to spill across columns.
=SJS.TABLE(B2, B3:H3, A2)Each column returns the evaluated result for the corresponding input value.
Two Variables
Use this pattern when the result depends on two independent input variables.
=SJS.TABLE(A2, B2:H2, B1, A3:A5, A1)The returned two-dimensional array represents all combinations of the supplied row and column inputs.
Multiple Input Variables (Beyond Two)
SJS.TABLE supports more than two input variable pairs within a single formula.
A1: =B1 * C1 * D1

=SJS.TABLE(A1, {1,2,3}, B1, {1,2,3}, C1, {1;-1}, D1)
The result includes every combination of the supplied input values.
Using Inline Arrays or Dynamic Arrays
Inputs do not need to come from worksheet ranges. Inline arrays and dynamic array functions are supported.
=SJS.TABLE(B1, {1,2,3}, A1)

=SJS.TABLE(B1, SEQUENCE(2,2), A1)
The returned result matches the structure of the provided input array.
Nesting Inside Other Functions
Because SJS.TABLE is a standard formula, it can be wrapped inside other functions.
=SUM(SJS.TABLE(A1, B2:B10, A2))Complete Example — Two-Variable Data Table
The following example demonstrates a complete two‑variable data table scenario.
In this example:
Price and Discount are input variables.
Net Income is calculated based on estimated sales volume.
SJS.TABLEevaluates Net Income across multiple combinations of Price and Discount.
var spread = new GC.Spread.Sheets.Workbook('ss');
spread.options.allowDynamicArray = true;
spread.suspendPaint();
var sheet = spread.getActiveSheet();

// Define the model inputs and formulas that will be recalculated by the data table.
sheet.setArray(0, 0, [
    ['Price', 300],
    ['Discount', 0],
    ['Sales Volume'],
    ['Net Income']
]);
sheet.setFormula(2, 1, '=ROUND(P3+O3*B1+B2*N3,0)');
sheet.setFormula(3, 1, '=B3*(B1*(1-B2)-130)');

// Use historical price and discount data to estimate future sales volume with LINEST.
sheet.getRange('N2').value('Calculate LINEST by History data');
sheet.getRange('N3').formula('=LINEST(P8:.P17,N8:.O17)');
sheet.setArray(5, 13, [
    ['History data', null, null, 'Estimated Sales Volume\nBy LINEST Result'],
    ['Price', 'Discount', 'Sales Volume'],
    [300, 0, 38],
    [250, 0.1, 62],
    [300, 0.2, 60],
    [320, 0.25, 60],
    [200, 0.1, 70]
]);

// Show the fitted sales-volume result for each historical record.
sheet.getRange('Q8:Q13').formula('=ROUND(N$3*O8+O$3*N8+P$3,0)', true);

// Build the what-if analysis grid: discounts across the top, prices down the left.
sheet.setArray(5, 0, [
    ['Predict Table', null, 'Discount'],
    [null, null, 0, 0.05, 0.1, 0.15, 0.2, 0.25, 0.3, 0.35]
]);

// The top-left formula cell contains the result that SJS.TABLE will reevaluate.
sheet.setFormula(6, 1, '=B4');
sheet.setValue(7, 0, 'Price');

for (let i = 0; i < 34; i++) {
    sheet.setValue(7 + i, 1, 150 + i * 10);
}

// Generate a two-variable data table.
sheet.setFormula(7, 2, '=SJS.TABLE(B7,C7:J7,B2,B8:B41,B1)');

spread.resumePaint();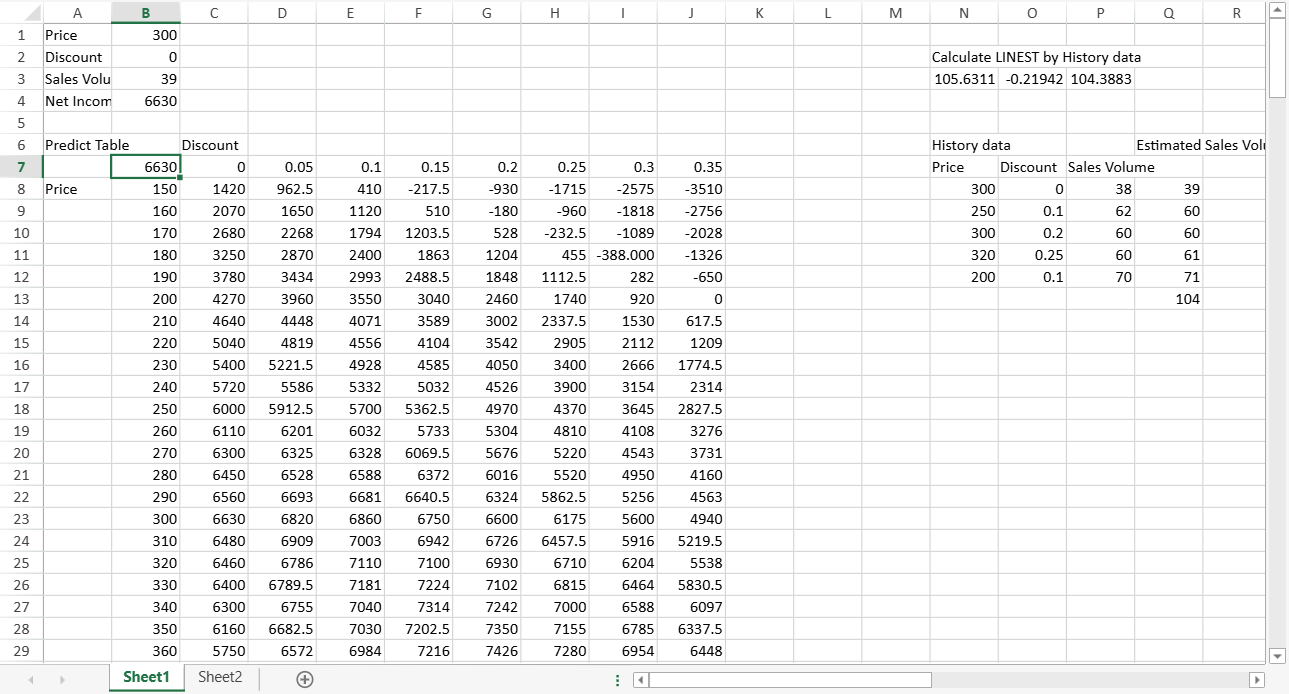
Result Structure
The formula entered in C8 spills into a dynamic array of 34 rows by 8 columns.
This size is determined by:
C7:J7→ 8 discount values (1 × 8)B8:B41→ 34 price values (34 × 1)B7→ single‑cell result reference
Because result_reference is a single cell, the output expands to match the maximum row and column dimensions across all inputs.
The resulting grid:
Each row corresponds to one price value.
Each column corresponds to one discount value.
Each cell represents the recalculated Net Income for that specific combination.
Differences from Excel Data Tables
Compared to Excel’s legacy data tables, SJS.TABLE:
Is a standard worksheet formula that can be edited and copied.
Allows inserting or deleting rows and columns within the result range.
Supports more than two input variables.
Accepts array values, named ranges, and cross-sheet references.
Can be nested inside other formulas.
Notes
SJS.TABLEdoes not support use with asynchronous functions. When combined with async functions that rely ondefaultValueorsetAsyncResult, results may be unpredictable.During the evaluation of
SJS.TABLE, internal cell updates are performed without triggering collaboration synchronization. Collaboration resumes automatically after calculation completes.waitForAllCalculations()waits until allSJS.TABLEsimulations are completed.