


- SpreadJS Overview
- Getting Started
- JavaScript Frameworks
- Best Practices
-
Features
- Workbook
- Worksheet
- Rows and Columns
- Headers
- Cells
- Data Binding
- Data Manager
- TableSheet
- GanttSheet
- ReportSheet
- Data Charts
- JSON Schema with SpreadJS
- SpreadJS File Format
- Data Validation
- Conditional Formatting
- Sort
- Group
- Formulas
- What-If Analysis
- Serialization
- Keyboard Actions
- Shapes
- Floating Objects
- Barcodes
- Charts
-
Sparklines
- Column, Line, and Winloss Sparklines with Methods
- Markers and Points
- Horizontal and Vertical Axes
- Column, Line, and Winloss Sparklines with Formulas
- Area Sparkline
- Pie Sparkline
- Scatter Sparkline
- Bullet Sparkline
- Spread Sparkline
- Stacked Sparkline
- Hbar Sparkline
- Vbar Sparkline
- Box Plot Sparkline
- Vari Sparkline
- Cascade Sparkline
- Pareto Sparkline
- Month Sparkline
- Year Sparkline
- Custom Sparkline
- Rangeblock Sparkline
- Image Sparkline
- Histogram Sparkline
- Gauge KPI Sparkline
- Lollipop Variance Sparkline
- Progress Sparkline
- Tables
- Pivot Table
- Slicer
- Theme
- User Management
- Culture
- AI Assistant
- SpreadJS Designer
- SpreadJS Designer VSCode Plugin
- Tutorials
- SpreadJS Designer Component
- SpreadJS Collaboration Server
- Touch Support
- Formula Reference
- Import and Export Reference
- Events
- API Documentation
- Release Notes
Progress Sparkline
The Progress Sparkline displays progress directly inside a cell. You can use it to show completion status, readiness, quota progress, or other ratio-based values without adding a separate chart.
A progress value is treated as a ratio from 0 to 1. For example, 0.37 represents 37%.
Configure a Progress Sparkline
The ProgressSparkline Setting dialog provides the following options:
Setting | Description |
|---|---|
Value | Specifies the progress value, cell reference, or supported range expression that resolves to a numeric ratio. Use a ratio from |
Mode | Specifies the visual style of the Progress Sparkline. |
Bar Color | Sets the color of the completed portion. |
Band Color | Sets the color of the remaining portion or track. |
Show Value | Shows or hides the percentage text. |
By default, Designer uses mode
0,Accent 1as the bar color,Accent 1 80as the band color, and shows the percentage text.
Progress Modes
The mode argument specifies the visual style of the Progress Sparkline.
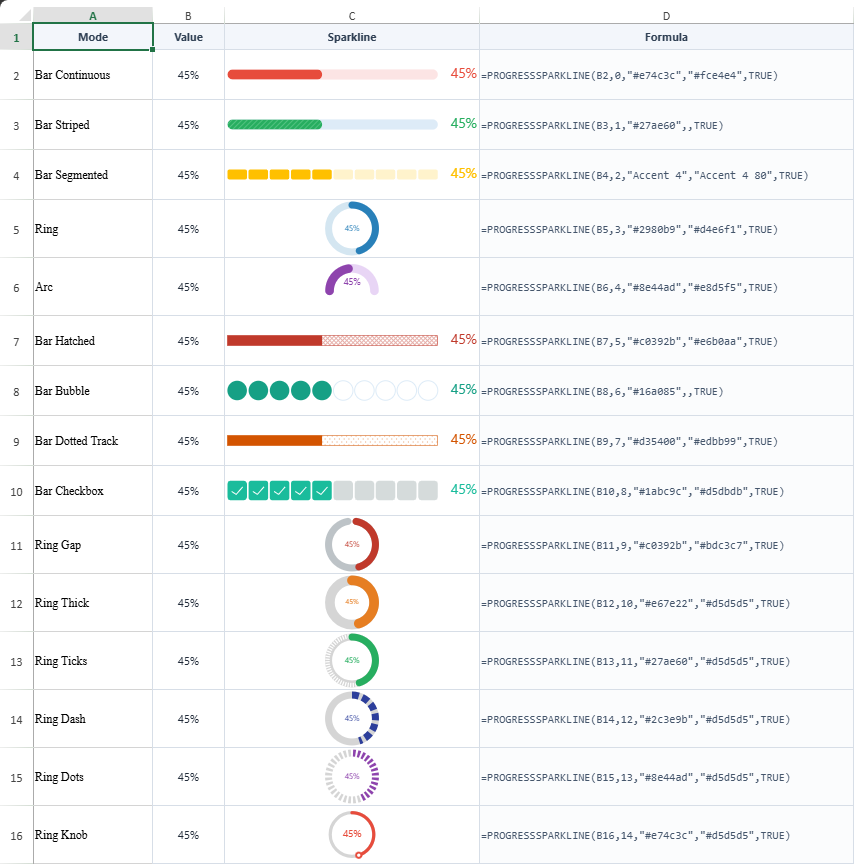
Mode | Name | Description | Example |
|---|---|---|---|
| Bar Continuous | Horizontal rounded progress bar. |
|
| Bar Striped | Horizontal progress bar with diagonal stripes on the completed portion. |
|
| Bar Segmented | Discrete block segments. |
|
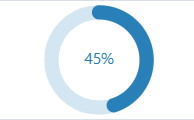
| Ring | Circular progress ring. |
|
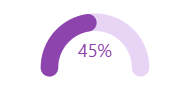
| Arc | Semi-circular gauge arc. |
|
| Bar Hatched | Filled bar with a hatched remaining track. |
|
| Bar Bubble | Filled and outlined circles for discrete progress steps. |
|
| Bar Dotted Track | Filled bar with a dotted remaining track. |
|
| Bar Checkbox | Checked and unchecked squares for progress steps. |
|
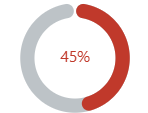
| Ring Gap | Circular ring with a fixed gap. |
|
| Ring Thick | Thick circular progress ring. |
|
| Ring Ticks | Circular ring with tick marks. |
|
| Ring Dash | Circular ring with dashed progress segments. |
|
| Ring Dots | Circular ring with dotted progress segments. |
|
| Ring Knob | Circular ring with an endpoint dot indicator. |
|







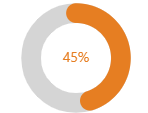
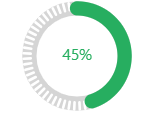
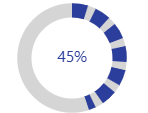
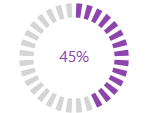
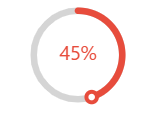
Example
The following example creates Progress Sparklines with different styles and color settings.
var sheet = spread.getActiveSheet();

sheet.setColumnWidth(0, 180);
sheet.setColumnWidth(1, 80);
sheet.setColumnWidth(2, 200);

sheet.getRange(0, 0, 4, 3).vAlign(GC.Spread.Sheets.VerticalAlign.center);

for (var r = 0; r < 4; r++) {
    sheet.setRowHeight(r, 80);
}

// Theme color, literal value, and visible percentage text.
sheet.setValue(0, 0, "Project Delivery");
sheet.setFormula(0, 2, '=PROGRESSSPARKLINE(0.37,1,"Accent 1","Accent 1 80")');

// CSS color, literal value, and hidden percentage text.
sheet.setValue(1, 0, "Release Readiness");
sheet.setFormula(1, 2, '=PROGRESSSPARKLINE(0.37,4,"#8e44ad","#e8d5f5",FALSE)');

// Theme color, cell reference, and visible percentage text.
sheet.setValue(2, 0, "Sales Quota");
sheet.setValue(2, 1, 0.73);
sheet.setFormula(2, 2, '=PROGRESSSPARKLINE(B3,14,"Accent 2","Accent 2 80")');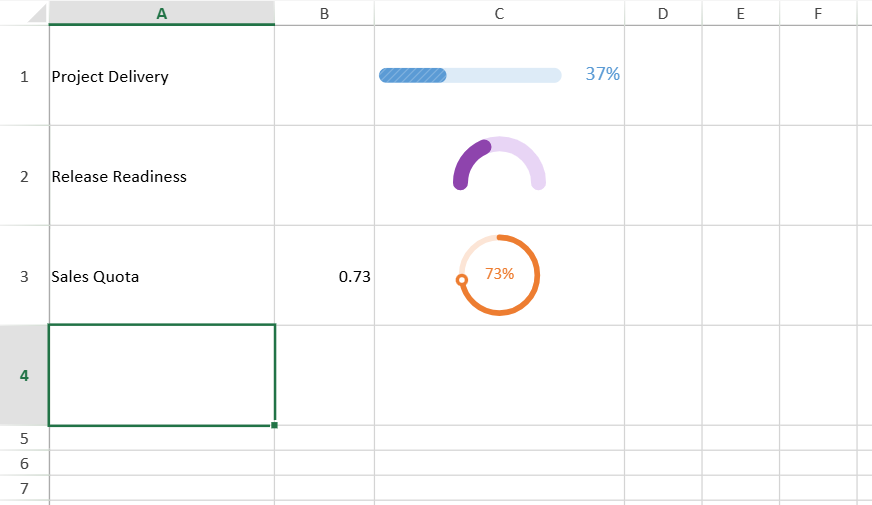
Notes
Progress values are interpreted as ratios. Use
0.75for75%.Blank or empty values are displayed as
0.Values less than
0are displayed as0.Values greater than
1are displayed as1.If the value or mode is invalid, the formula returns
#VALUE!.The Progress Sparkline is formula-driven and is displayed inside the cell that contains the formula.