
- WPF FlexChart Overview
- Getting Started with WPF Edition
- FlexChart
- FlexPie
- Sunburst Chart
- FlexRadar
- TreeMap
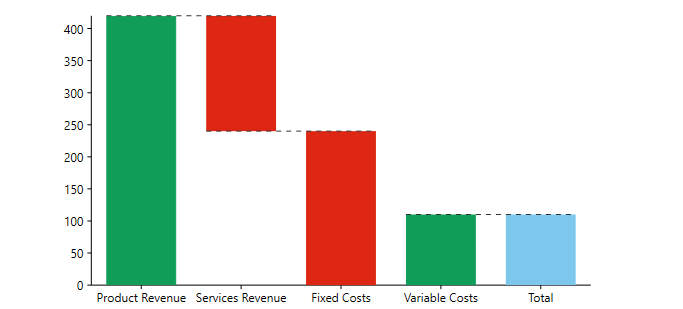
Waterfall Series
Waterfall series allows you to understand the cumulative effect of sequential positive or negative values. It is useful to understand the effect of a series of positive and negative values on an initial value. The series depicts color coded columns to easily distinguish positive values from negative values. Generally initial and final values are depicted by total columns, while intermediate values are represented by floating columns. It is recommended to use Waterfall series when there is a column of category text and a mix of positive and negative values. Such cases are mostly found in quantitative analysis like inventory analysis or performance analysis, where the chart shows the gradual transition in the quantitative value of an entity subjected to increment or decrement.
FlexChart provides features that can be implemented and customized for enhanced data visualization through Waterfall series.
- Connector lines: Connector lines are the lines that connect color coded columns to display the flow of data in the chart. To show connector lines, set the ConnectorLines property of the WaterFall class to True.
- Connector lines customization: Once displayed, connector lines can be customized using the ConnectorLineStyle property that allows you to access styling properties of the ChartStyle class.
- Columns customization: To clearly differentiate positive values from negative values or total, you can apply various styles to the columns showing these values. For that, you can use various properties, such as RisingStyle, FallingStyle, TotalStyle, or StartStyle provided by the Waterfall class.
The following image displays Waterfall series displaying the cumulative effect of sequential positive and negative values.
To use the Waterfall series in FlexChart, create an instance of the Waterfall class, which inherits the Series class, and add the created instance to the FlexChart Series collection using the Series property provided by the C1FlexChart class.
The following code snippet illustrates how to set various properties while working with Waterfall series in FlexChart. The code snippet first creates a class DataCreator to generate data for the chart, and then binds the series to the data source.
vbnet
Class DataCreator
    Public Shared Function CreateData() As List(Of DataItem)
        Dim data = New List(Of DataItem)()
        data.Add(New DataItem("製品の収入", 420))
        data.Add(New DataItem("サービスの収入", -180))
        data.Add(New DataItem("固定費", 130))
        data.Add(New DataItem("変動費用", -20))
        Return data
    End Function
End Class
Public Class DataItem
    Public Sub New(costs__1 As String, amount__2 As Integer)
        Costs = costs__1
        Amount = amount__2
    End Sub
    Public Property Costs() As String
        Get
            Return m_Costs
        End Get
        Set
            m_Costs = Value
        End Set
    End Property
    Private m_Costs As String
    Public Property Amount() As Integer
        Get
            Return m_Amount
        End Get
        Set
            m_Amount = Value
        End Set
    End Property
    Private m_Amount As Integer
End Class
csharp
using System.Collections.Generic;
namespace Waterfall
{
    class DataCreator
    {
        public static List<DataItem> CreateData()
        {
            var data = new List<DataItem>();
            data.Add(new DataItem("製品の収入", 420));
            data.Add(new DataItem("サービスの収入", -180));
            data.Add(new DataItem("固定費", 130));
            data.Add(new DataItem("変動費用", -20));
            return data;
        }
    }
    public class DataItem
    {
        public DataItem(string costs, int amount)
        {
            Costs = costs;
            Amount = amount;
        }
        public string Costs { get; set; }
        public int Amount { get; set; }
    }
}
Here is the code snippet for binding the FlexChart to the data source.
xml
<Window
        xmlns="http://schemas.microsoft.com/winfx/2006/xaml/presentation"
        xmlns:x="http://schemas.microsoft.com/winfx/2006/xaml"
        xmlns:d="http://schemas.microsoft.com/expression/blend/2008"
        xmlns:mc="http://schemas.openxmlformats.org/markup-compatibility/2006"
        xmlns:local="clr-namespace:Waterfall"
        xmlns:c1="http://schemas.componentone.com/winfx/2006/xaml" x:Class="Waterfall.MainWindow"
        mc:Ignorable="d"
        DataContext="{Binding RelativeSource={RelativeSource Mode=Self}}"
        Title="MainWindow" Height="528.558" Width="712.292">
        <Grid>
            <c1:C1FlexChart x:Name="flexChart"
                            BindingX="Costs"
                            ItemsSource="{Binding DataContext.Data}"
                            Margin="55,161,51,28">
                <c1:C1FlexChart.Series>
                    <c1:Waterfall Binding="Amount"
                                  ConnectorLines="True"
                                  ShowTotal="True"
                                  ShowIntermediateTotal="True">
                        <c1:Waterfall.StartStyle>
                            <c1:ChartStyle Fill="#7dc7ed" />
                        </c1:Waterfall.StartStyle>
                        <c1:Waterfall.FallingStyle>
                            <c1:ChartStyle Fill="#dd2714" />
                        </c1:Waterfall.FallingStyle>
                        <c1:Waterfall.RisingStyle>
                            <c1:ChartStyle Fill="#0f9d58"
                                           Stroke="#0f9d58" />
                        </c1:Waterfall.RisingStyle>
                        <c1:Waterfall.IntermediateTotalStyle>
                            <c1:ChartStyle Fill="#7dc7ed" />
                        </c1:Waterfall.IntermediateTotalStyle>
                        <c1:Waterfall.TotalStyle>
                            <c1:ChartStyle Fill="#7dc7ed" />
                        </c1:Waterfall.TotalStyle>
                        <c1:Waterfall.ConnectorLineStyle>
                            <c1:ChartStyle Stroke="#333"
                                           StrokeDashArray="5,5"/>
                        </c1:Waterfall.ConnectorLineStyle>
                    </c1:Waterfall>
                </c1:C1FlexChart.Series>
            <c1:C1FlexChart.AxisY>
                <c1:Axis Min="0"></c1:Axis>
            </c1:C1FlexChart.AxisY>
            </c1:C1FlexChart>
        </Grid>
</Window>
Code
// clear the FlexChart series collection
flexChart.Series.Clear();
// create an instance of the Waterfall series
C1.WPF.Chart.Waterfall waterFall = new C1.WPF.Chart.Waterfall();
// add the instance to Series collection
flexChart.Series.Add(waterFall);
// bind the field containing Y values for the series
waterFall.Binding = "Amount";
// bind the field containing X values for the FlexChart
flexChart.BindingX = "Costs";
// set the ConnectorLines property
waterFall.ConnectorLines = true;
// set the ShowTotal property
waterFall.ShowTotal = true;
' clear the FlexChart series collection
flexChart.Series.Clear()
' create an instance of the Waterfall series
Dim waterFall As New C1.WPF.Chart.Waterfall()
' add the instance to Series collection
flexChart.Series.Add(waterFall)
' bind the field containing Y values for the series
waterFall.Binding = "Amount"
' bind the field containing X values for the FlexChart
flexChart.BindingX = "Costs"
' set the ConnectorLines property
waterFall.ConnectorLines = True
' set the ShowTotal property
waterFall.ShowTotal = True