
- WPF FlexChart Overview
- Getting Started with WPF Edition
- FlexChart
- FlexPie
- Sunburst Chart
- FlexRadar
- TreeMap
Error Bar
Error Bar series allows you to indicate variability of data or uncertainty in values. It enables you to display standard deviations and a range of error in variable data using error bars. Generally, results of scientific studies or experimental sciences use error bars in charts to depict variations in data from original values.
FlexChart lets you use Error Bar series in different chart types including Area, Column, Line, LineSymbols, Scatter, Spline, SplineArea, and SplineSymbols.
Error Bar series in FlexChart offers several features, as follows:
- Error amount: Set up error bars on all data points using different ways, such as a fixed value, percentage, standard error, or standard deviation. In addition, it is possible to set a custom value to show a precise error amount, if required. To display error bars in any of these ways, set the ErrorAmount property from the ErrorAmount enumeration.
- Direction: Show error bars in the Plus, the Minus, or even both directions by setting the Direction property from the ErrorBarDirection enumeration.
- End style: Display error bars with or without caps by setting the EndStyle property from the ErrorBarEndStyle enumeration.
- Bar style: Customize the appearance of error bars using the ErrorBarStyle property.
The following image displays Plus and Minus error amounts in the mean MCA (Middle Cerebral Artery) velocity data for different seizure types observed in children.
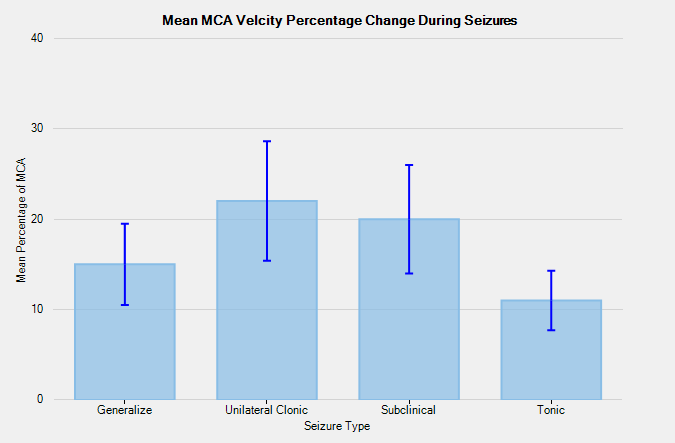
The following code uses mean percentage values of MCA velocity during different kinds of seizures in children. The codes shows how to implement ErrorBar series in FlexChart.
DATACREATOR.vbnet
Class DataCreator
    Public Shared Function CreateData() As List(Of DataItem)
        Dim data = New List(Of DataItem)()
        data.Add(New DataItem("Generalize", 15))
        data.Add(New DataItem("Unilateral Clonic", 22))
        data.Add(New DataItem("Subclinical", 20))
        data.Add(New DataItem("Tonic", 11))
        Return data
    End Function
End Class
Public Class DataItem
    Public Sub New(seizuretype__1 As String, meanmca__2 As Integer)
        SeizureType = seizuretype__1
        MeanMCA = meanmca__2
    End Sub
    Public Property SeizureType() As String
        Get
            Return m_SeizureType
        End Get
        Set
            m_SeizureType = Value
        End Set
    End Property
    Private m_SeizureType As String
    Public Property MeanMCA() As Integer
        Get
            Return m_MeanMCA
        End Get
        Set
            m_MeanMCA = Value
        End Set
    End Property
    Private m_MeanMCA As Integer
End Class
csharp
class DataCreator
{
    public static List<DataItem> CreateData()
    {
        var data = new List<DataItem>();
        data.Add(new DataItem("Generalize", 15));
        data.Add(new DataItem("Unilateral Clonic", 22));
        data.Add(new DataItem("Subclinical", 20));
        data.Add(new DataItem("Tonic", 11));
        return data;
    }
}
public class DataItem
{
    public DataItem(string seizuretype, int meanmca)
    {
        SeizureType = seizuretype;
        MeanMCA = meanmca;
    }
    public string SeizureType { get; set; }
    public int MeanMCA { get; set; }
}
vbnet
Partial Public Class MainWindow
    Inherits Window
    Private _data As List(Of DataItem)
    Public Sub New()
        InitializeComponent()
        ' clear data series collection
        flexChart.Series.Clear()
        ' create ErrorBar series
        Dim errorBar As New C1.WPF.Chart.ErrorBar()
        ' add the series to the data series collection
        flexChart.Series.Add(errorBar)
        ' bind X-axis and Y-axis
        flexChart.BindingX = "SeizureType"
        errorBar.Binding = "MeanMCA"
        ' specify error amount of the series
        errorBar.ErrorAmount = C1.Chart.ErrorAmount.Percentage
        ' specify the direction of the error
        errorBar.Direction = C1.Chart.ErrorBarDirection.Both
        ' specify the error value of the series
        errorBar.ErrorValue = 0.3
        ' style the ErrorBar series
        errorBar.EndStyle = C1.Chart.ErrorBarEndStyle.Cap
    End Sub
    Public ReadOnly Property Data() As List(Of DataItem)
        Get
            If _data Is Nothing Then
                _data = DataCreator.CreateData()
            End If
            Return _data
        End Get
    End Property
End Class
csharp
public partial class MainWindow : Window
{
    private List<DataItem> _data;
    public MainWindow()
    {
        InitializeComponent();
        // clear data series collection
        flexChart.Series.Clear();
        // create ErrorBar series
        C1.WPF.Chart.ErrorBar errorBar = new C1.WPF.Chart.ErrorBar();
        // add the series to the data series collection
        flexChart.Series.Add(errorBar);
        // bind X-axis and Y-axis
        flexChart.BindingX = "SeizureType";
        errorBar.Binding = "MeanMCA";
        // specify error amount of the series
        errorBar.ErrorAmount = C1.Chart.ErrorAmount.Percentage;
        // specify the direction of the error
        errorBar.Direction = C1.Chart.ErrorBarDirection.Both;
        // specify the error value of the series
        errorBar.ErrorValue = .3;
        // style the ErrorBar series
        errorBar.EndStyle = C1.Chart.ErrorBarEndStyle.Cap;
    }
    public List<DataItem> Data
    {
        get
        {
            if (_data == null)
            {
                _data = DataCreator.CreateData();
            }
            return _data;
        }
    }
}