- FlexReport for WinForms Overview
- Key Features
- FlexReport versus other Reporting Controls
- Core Classes
- Design-Time Support
- Quick Start
- FlexReport Designer
- FlexReportDesigner Control
- Data Binding
- Load Reports
- Create Reports
- Sections of FlexReport
- Fields and Custom Fields
- Modifying the Fields
- Parameters
- VBScripting with ExpressionEditor
- Filtering Data
- Grouping Data
- Sorting Data
- Customize Reports
- Styling the Reports
- Export Reports
- Preview and Print Reports
- Deployment
- FlexViewer
DiagramChart Field
The DiagramChart field is a specialized report field used to visualize graph-based structures such as organizational charts and relationship diagrams. It supports both bound and unbound configurations, enabling flexible diagram creation based on a data source or manually defined elements.
The DiagramChart field supports the following scenarios:
Rendering hierarchical or relational data from a data source (Bound Mode)
Defining nodes and edges manually (Unbound Mode)
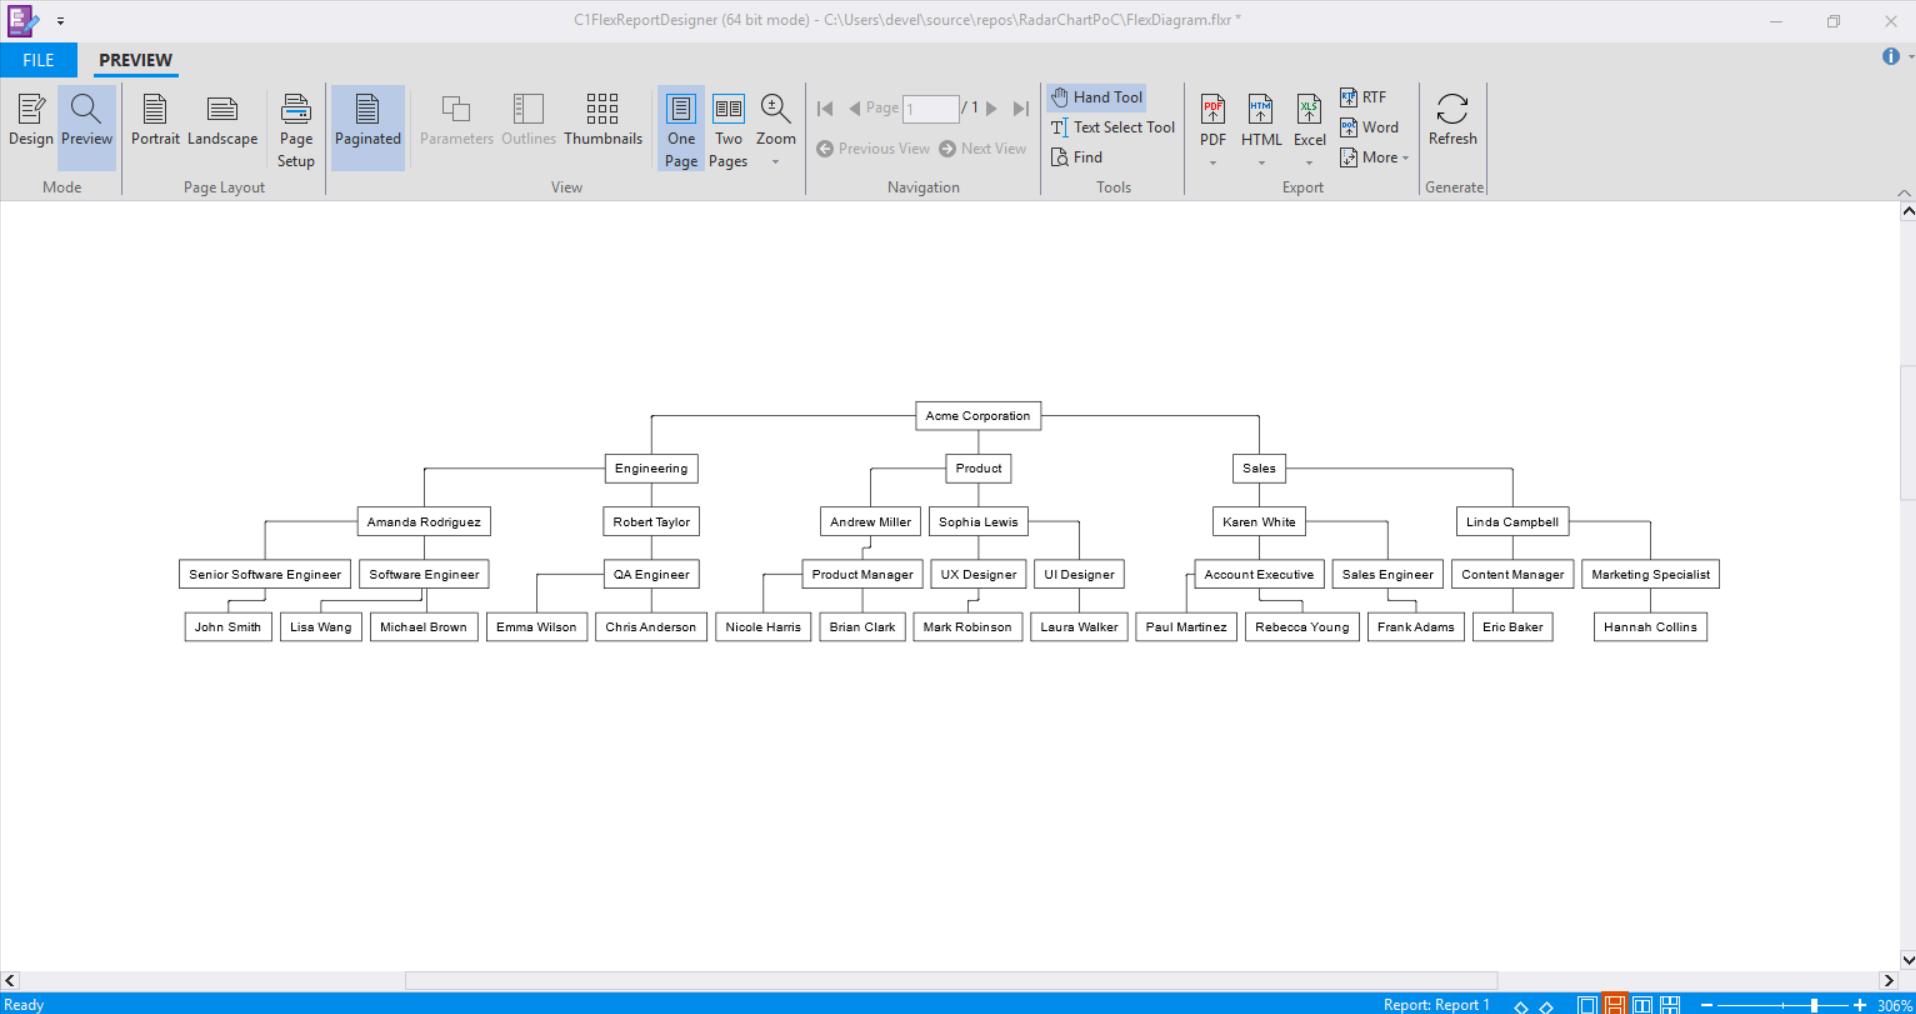
Bind a DiagramChart Field to Data (Bound Mode)
After adding a DiagramChart field to a report, the field can be bound to a data source to render structured data.
To bind a DiagramChart field to data:
1. Create a new Microsoft Excel worksheet named OrgChart_Data.
2. Add the following columns and populate them with data:
Company | Department | Manager | Employee | JobTitle |
|---|---|---|---|---|
Acme Corporation | Engineering | Amanda Rodriguez | John Smith | Senior Software Engineer |
Acme Corporation | Engineering | Amanda Rodriguez | Lisa Wang | Software Engineer |
Acme Corporation | Engineering | Amanda Rodriguez | Michael Brown | Software Engineer |
Acme Corporation | Engineering | Robert Taylor | Emma Wilson | QA Engineer |
Acme Corporation | Engineering | Robert Taylor | Chris Anderson | QA Engineer |
Acme Corporation | Product | Andrew Miller | Nicole Harris | Product Manager |
Acme Corporation | Product | Andrew Miller | Brian Clark | Product Manager |
Acme Corporation | Product | Sophia Lewis | Mark Robinson | UX Designer |
Acme Corporation | Product | Sophia Lewis | Laura Walker | UI Designer |
Acme Corporation | Sales | Karen White | Paul Martinez | Account Executive |
Acme Corporation | Sales | Karen White | Rebecca Young | Account Executive |
Acme Corporation | Sales | Karen White | Frank Adams | Sales Engineer |
Acme Corporation | Sales | Linda Campbell | Eric Baker | Content Manager |
Acme Corporation | Sales | Linda Campbell | Hannah Collins | Marketing Specialist |
3. Save the Excel file.
4. Create a new report in FlexReportDesigner.
5. In the Data tab, bind the main data source to the OrgChart_Data table.
For detailed data-binding instructions, refer to the FlexReport QuickStart documentation.
6. Configure the data link properties:
a. Open the All tab.
b. Locate Extended Properties.
c. Set the value to:
Excel 12.0 Xml;HDR=YES;IMEX=1This setting specifies that the data source is an Excel file with column headers in the first row.
7. On the Insert tab, add the DiagramChart field to the report header section.
8. Select the DiagramChart field on the design surface.
9. In the Properties window:
a. Set DataSourceName to:
Mainb. Set Binding to:
Company, Department, Manager, JobTitle, Employee10. Preview the report to render the diagram.
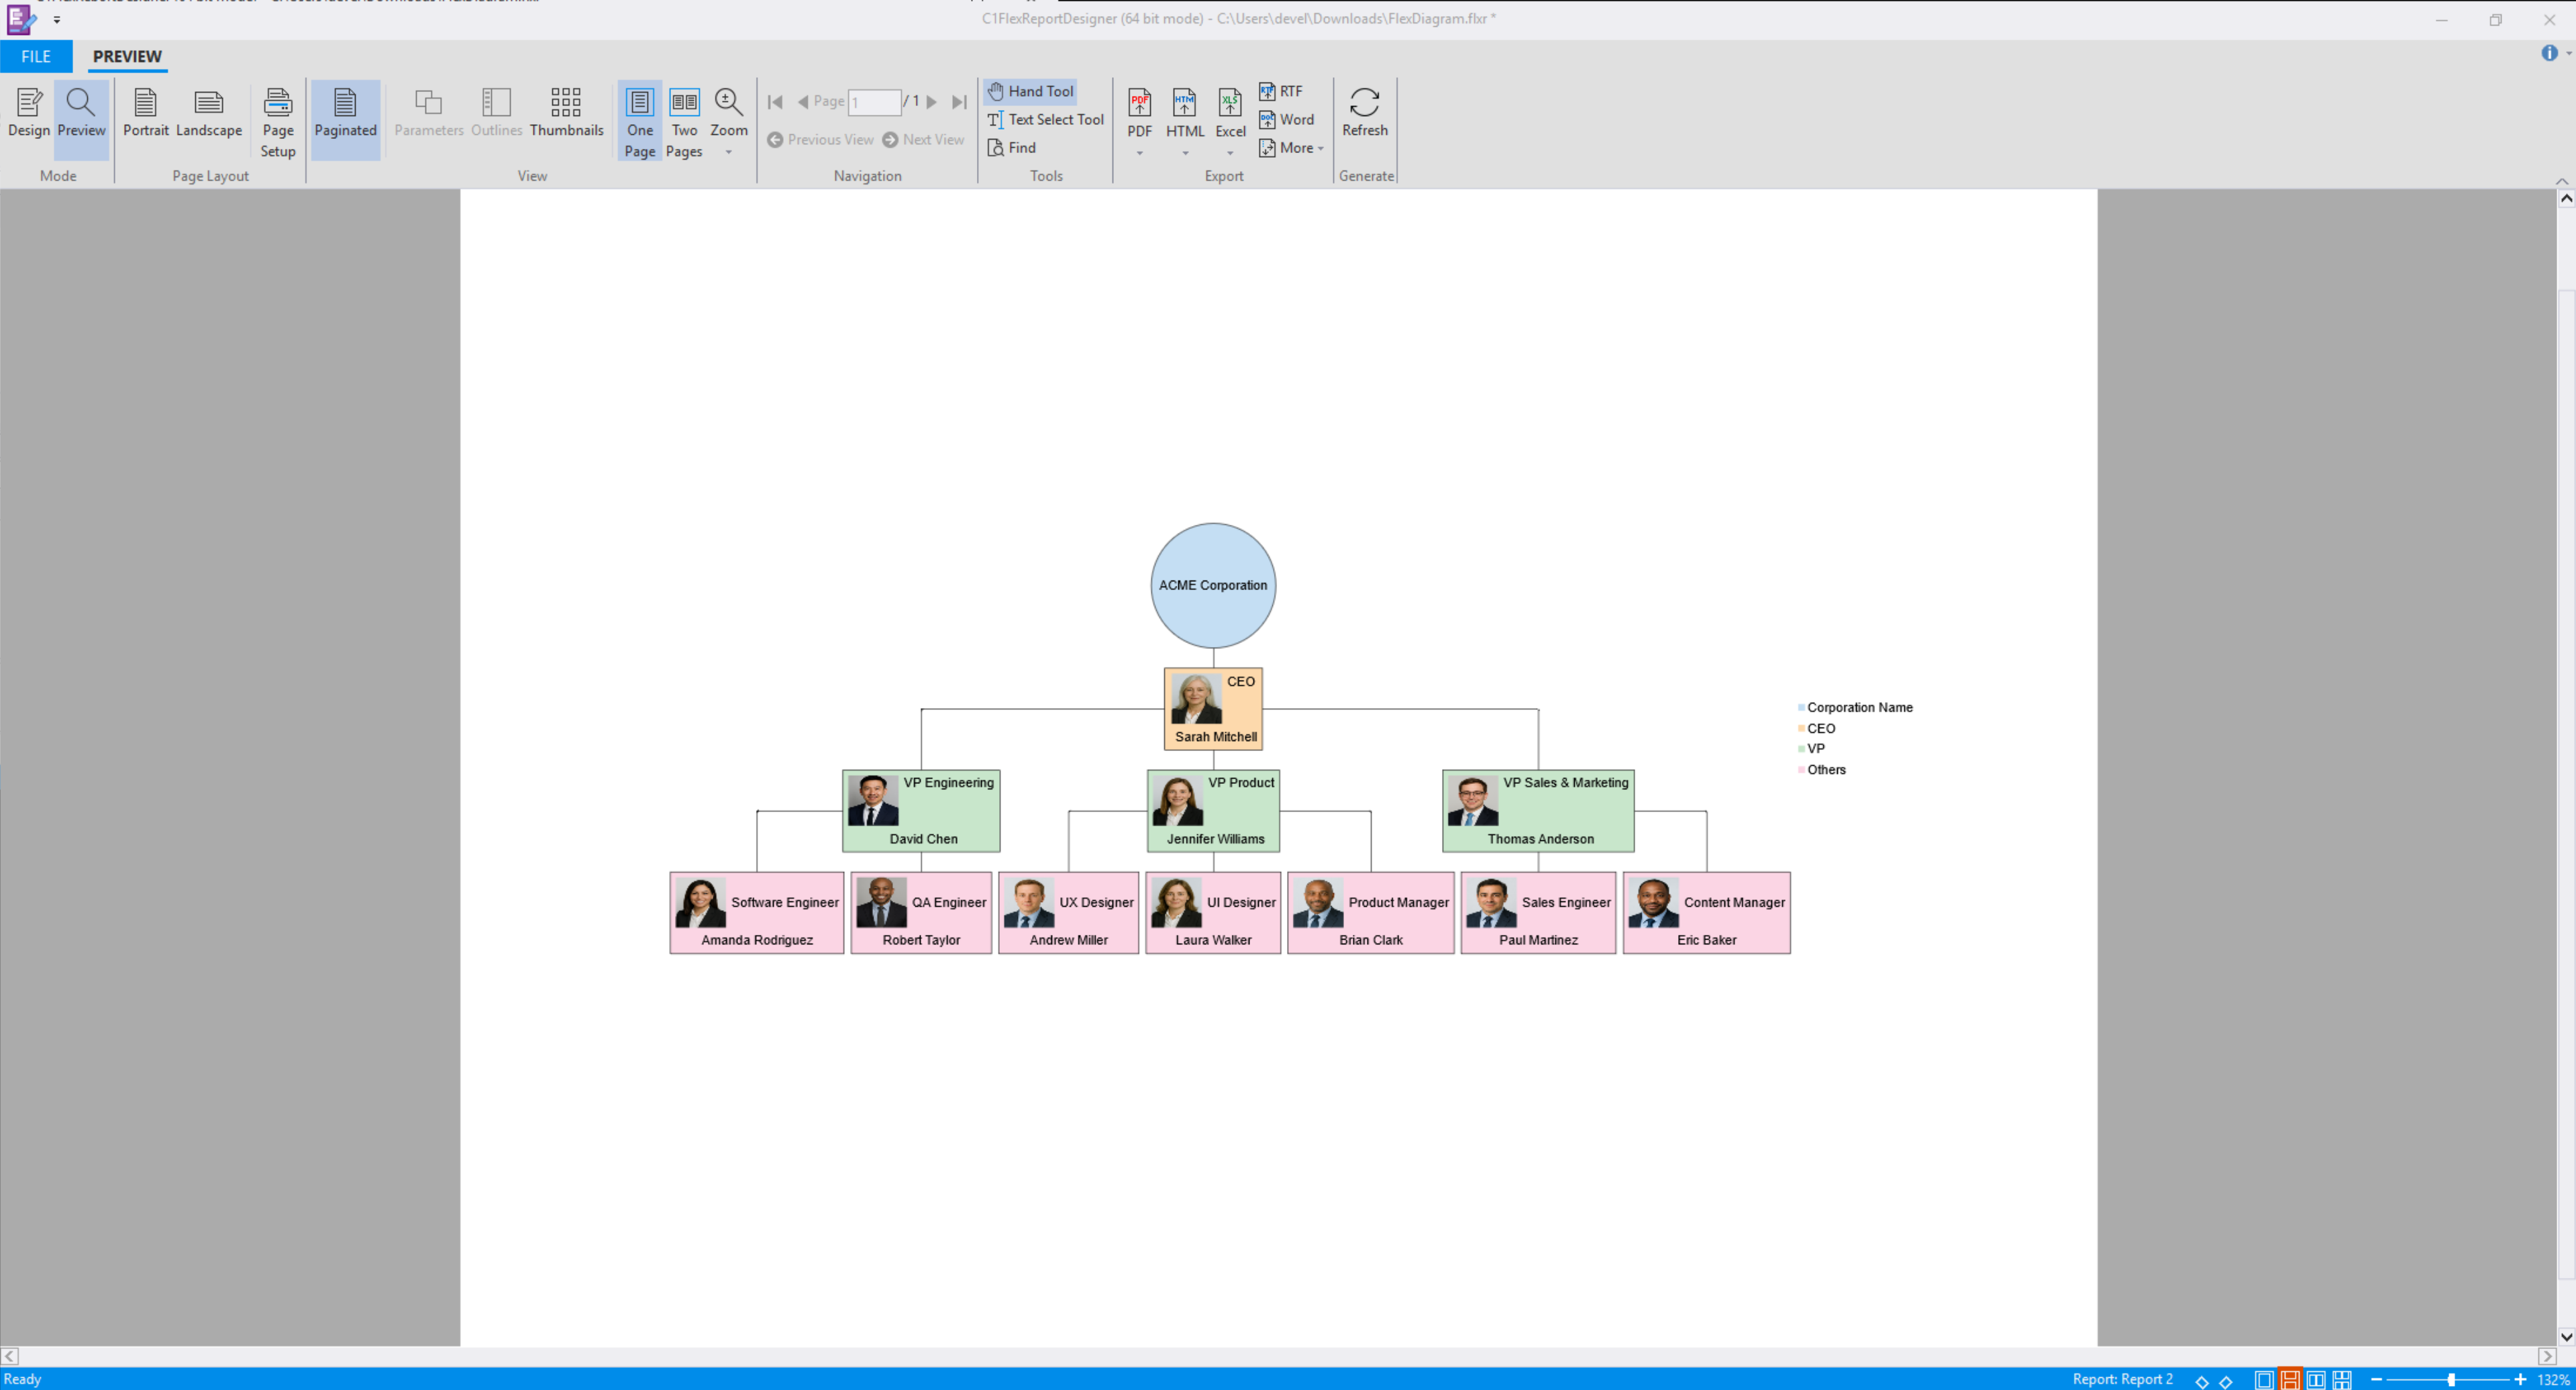
Define Nodes and Edges (Unbound Mode)
Unbound Mode enables manual construction of diagram structures without using a data source.
To define nodes and edges manually:
1. Create a new report in FlexReportDesigner.
2. On the Insert tab, add the DiagramChart field to the report header section.
3. Select the DiagramChart field on the design surface.
4. In the Properties window, navigate to:
Misc > Diagram > NodesThen open the editor
5. Add nodes and configure properties such as:
ShapeStyleContentLegendItemTitleTitleImageThen open the editor.
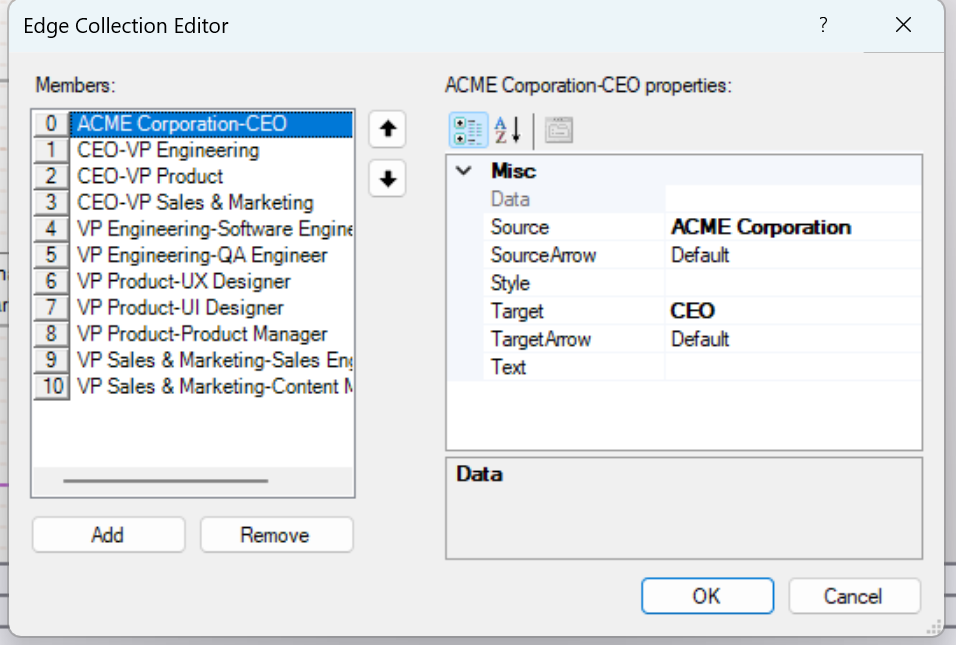
6. In the Properties window, navigate to:
Misc > Diagram > EdgesThen open the editor.
7. Define edges by specifying:
SourceTarget
8. Preview the report to render the diagram.