
- FlexReport for WinForms Overview
- Key Features
- FlexReport versus other Reporting Controls
- Core Classes
- Design-Time Support
- Quick Start
- FlexReport Designer
- FlexReportDesigner Control
- Data Binding
- Load Reports
- Create Reports
- Sections of FlexReport
- Fields and Custom Fields
- Modifying the Fields
- Parameters
- VBScripting with ExpressionEditor
- Filtering Data
- Grouping Data
- Sorting Data
- Customize Reports
- Styling the Reports
- Export Reports
- Preview and Print Reports
- Deployment
- FlexViewer
FlexChart Field
FlexReportDesigner provides the field type, FlexChart field. The FlexChart field simplifies adding data visualization capabilities to FlexReport using flexible data binding, multiple chart types, and supports grouping and data aggregation.
For more information on FlexChart, see FlexChart documentation.
Binding FlexChart Field with Data
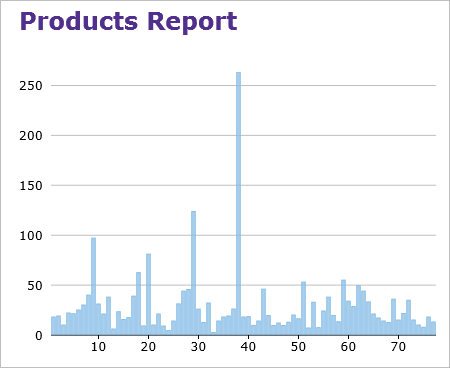
When you add the FlexChart field to your report, you need to bind it to data for populating the data in the displayed chart, say Column chart, as shown below. The following steps show how to bind the FlexChart field with data in FlexReportDesigner application.
Create a new report in FlexReportDesigner.
In Data tab, bind the Main data source with Products table of C1Nwind.mdb database.
Under INSERT tab, select FlexChart field
 and draw it in the Header section.
Select the FlexChart.
In the Properties window, set the desired Chart Type, say Column chart, from ChartType dropdown.
Navigate to Series and click the ellipsis button next to it.
In the Series Collection Editor, click Add button to add a series data group.
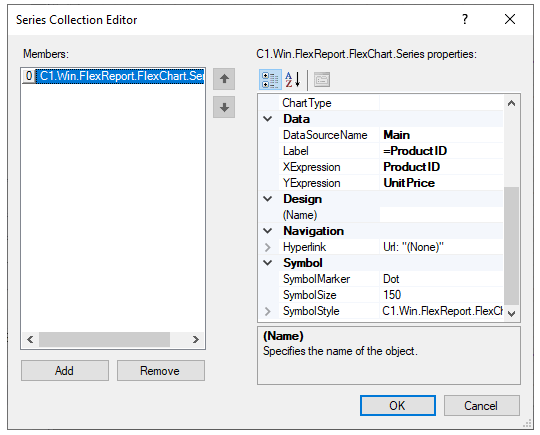
Navigate to Data and set the DataSourceName as Main.
Set Label as ProductID.
Set XExpression to ProductID.
Set YExpression to UnitPrice.
Close the Editor.
Click on Preview.
Comparison between FlexChartField and FlexChart
FlexChartField inherits majority of properties from FlexChart. However, since FlexChartField is used in reporting scenarios, few properties and their nature are different from FlexChart. The major difference between the two controls appears in binding the controls with data as the binding properties are different in FlexChartField from that of FlexChart. The following table shows the high-level object model difference between the FlexChartField (FlexReport) and FlexChart.
| FlexChartField (FlexReport) | FlexChart |
|---|---|
| - | AccessibleDescription |
| - | AccessibleName |
| - | AccessibleRole |
| - | AllowDrop |
| Anchor | Anchor |
| AutoHeight | - |
| AutoWidth | AutoWidth |
| AxisX | AxisX |
| AxisY | AxisY |
| Background | BackColor |
| - | BackgroundImage |
| - | BackgroundImageLayout |
| - | Binding |
| - | BindingMode |
| - | BindingX |
| Bookmark | - |
| Border | - |
| BodersPlitHorzMode | - |
| BordersSplitVertMode | - |
| - | CausesValidation |
| CategoryGroups | - |
| ChartType | ChartType |
| - | ContextMenuStrip |
| - | Cursor |
| DataLabel | DataLabel |
| - | DataMember |
| - | DataSource |
| - | Dock |
| DataSourceName | - |
| - | Enabled |
| Font | Font |
| Footer | Footer |
| - | ForeColor |
| ForcePageBreak | - |
| - | GenerateMember |
| Header | Header |
| Height | - |
| Hyperlink | - |
| - | ImeMode |
| Left | - |
| Legend | Legend |
| - | LegendToggle |
| - | Location |
| - | Locked |
| - | Margin |
| MarginBottom | - |
| MarginLeft | - |
| MarginRight | - |
| MarginTop | - |
| - | MaximumSize |
| - | MinimumSize |
| - | Modifiers |
| Options | Options |
| OutlineLabel | - |
| OutlineParent | - |
| - | Padding |
| Palette | Palette |
| PlotMargin | PlotMargin |
| PlotStyle | PlotStyle |
| - | RenderMode |
| RightToLeft | RightToLeft |
| Rotated | Rotated |
| - | SelectedIndex |
| - | SelectedMode |
| - | SelectionStyle |
| Series | Series |
| SeriesGroups | - |
| - | Size |
| - | SmoothingMode |
| SplitHorzBehavior | - |
| SplitVertBehavior | - |
| Stacking | Stacking |
| Tag | - |
| - | Text |
| - | ToolTip |
| Top | - |
| Visible | - |
| Width | - |
| XLabelExpression | - |
| - | UseWaitCursor |
| - | Visible |
| Zorder | - |
The following table shows the Series Object Model comparison.
| FlexChartField | FlexChart |
|---|---|
| AltStyle | AltStyle |
| Binding | |
| BindingMode | |
| BindingX | |
| ChartType | ChartType |
| DataMember | |
| DataSource | |
| DataSourceName | |
| Hyperlink | |
| Label | |
| Name | |
| Style | Style |
| SymbolMarker | SymbolMarker |
| SymbolSize | SymbolSize |
| SymbolStyle | SymbolStyle |
| Visibility | Visibility |
| XExpression | |
| Y1Expression | |
| Y2Expression | |
| Y3Expression | |
| YExpression |