
- 2D Chart for WinForms Overview
- Key Features
- Chart for WinForms Quick Start
- Design-Time Support
- Chart Fundamentals
- Common Usage for Basic 2D Charts
- Specific 2D Charts
- Design-Time Tools for Creating 2D Charts
- Charting Data
- Data Binding
- Charting Labels
- Chart Area and Plot Area Objects
- Customizing Chart Elements
- Loading and Saving Charts, Data, and Images
- End-User Interaction
- Chart for WinForms Samples
- Chart for WinForms Tutorials
-
Chart for WinForms Task-Based Help
- Rotating the Y-Axis Title
- Rotating Data Labels
- Displaying the Data Label as a Percent in Pie Charts
- Setting the Font Style for Data Labels
- Adding a Data Label on Top of Each Bar
- Wrapping Labels
- Adding a Transparent Label to Adjust the Gap Between the Values and the X-Axis
- Displaying both the Chart Legend and Chart Header
- Displaying the Legends Vertically
- Getting the Slice of a Pie with a Click
- Creating a Marker
- Add Scrollbar to the X-Axis and Y-Axis
- Add Symbols to Data Series
- Add ToolTips to Chart Elements
- Adding Visual Effects to Chart Elements
- Creating and Formatting Chart Elements Using the Properties Window
-
Creating and Formatting Chart Elements Using the Smart Designer
- Add a Chart Footer
- Add a Chart Header
- Add a Chart Legend
- Add Data Series to the Chart
- Add Data to the Data Series
- Add Labels to the Chart
- Choose a Chart Type
- Choose a Chart sub-type
- Edit the Chart Labels
- Edit the X and Y Axis
- Modify the Appearance of the Chart Footer
- Modify the Appearance of the Chart Header
- Modify the Appearance of the Chart Legend
- Modify the Appearance of the Data Series
- Modify the Color Theme of the Data Series
- Attach Chart Labels
- Candle Chart Tasks
- Frequently Asked Questions
Attach By Data Index
The Attached By Data Index command item gets the DataIndex member of the AttachMethodEnum and sets the value of the Label.AttachMethod property in the Label. It attaches the label to a specific data point on the plot area of the chart. The GroupIndex, PointIndex, and SeriesIndex properties can be specified. The following steps show how to attach the label using this method:
Select an existing Chart label and select the Attached By Data Index item from its drop-down menu.
Click on the Properties button of the Label toolbar and observe the following in its Edit labels editor:
- The AttachMethod is now set to DataIndex since the Attached by Data Index item was chosen.
- Expand the AttachMethodData object. Notice that the Point Index and Series Index properties each have a value associated with it. This is because the DataIndex attachment method attaches the labels by the data point. The GroupIndex value of 0 represents the ChartGroup0, the PointIndex value of 1 represents the second data point on the series, and the SeriesIndex value of 2 represents the third series on the chart.
The following image illustrates the two observations:
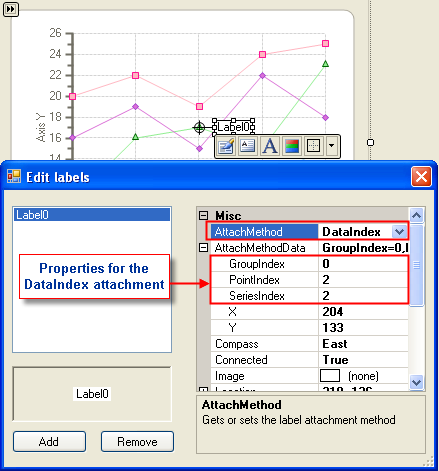
If you would like the label to represent a different data point then change the PointIndex and SeriesIndex properties in the Edit labels editor. For example, let's say we would like the label on series1, point3. In the Edit labels editor we change the SeriesIndex value to 1 and the PointIndex value to 3. The label appears on the series1, point3.