
- 2D Chart for WinForms Overview
- Key Features
- Chart for WinForms Quick Start
- Design-Time Support
- Chart Fundamentals
- Common Usage for Basic 2D Charts
- Specific 2D Charts
- Design-Time Tools for Creating 2D Charts
- Charting Data
- Data Binding
- Charting Labels
- Chart Area and Plot Area Objects
- Customizing Chart Elements
- Loading and Saving Charts, Data, and Images
- End-User Interaction
- Chart for WinForms Samples
- Chart for WinForms Tutorials
- Chart for WinForms Task-Based Help
Key Features
Chart for WinForms includes the following features for the C1Chart component:
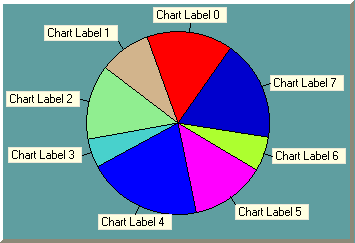
Chart type can be changed simply by setting one property field
Re-format any chart from line to bar to pie by simply changing one property. Get the exact chart representation you need for any application.
SmartDesigner provides highly-interactive chart building capabilities
Save substantial time using Chart's SmartDesigner, which handles everyday tasks in chart placement. Accomplish tasks without leaving the design form; each chart element reveals built-in toolbars and editors with the click of your mouse pointer.
For more information on the SmartDesigner see, Working with the Smart Designer.
Novice users can create a chart in three simple steps with the chart wizard
The Chart Wizard walks beginners through the steps of creating a new chart from start to finish: choose the chart type; modify chart elements such as header, footer, and legend; and edit the chart's data.
For more information on the Chart Wizard, see Working with the Chart Wizard.
You no longer have to tirelessly scroll through the Properties window to create a chart
C1Chart places the chart elements in an organized Chart Properties designer so you can quickly address chart details. Create or modify existing charts: choose from simple to complex chart types, and modify the data, axis elements, and appearance settings.
For more information on the Chart Properties designer, see Working with the Chart Properties designer.
Visually enhance chart elements with the intuitive Visual Effects designer
Enhance the chart elements' appearance by applying angle, gradient, intensity, scaling, and shape to change the effects of the light source.
For more information on chart's visual effects, see Visual Effects Designer. To see how to use the Visual Effects designer to apply visual effects to chart elements, see Adding Visual Effects to Chart Elements.
Choose from over 20 built-in color schemes
Apply color generation that mimics the Microsoft Office color themes to the data series with incredible ease.
For more information on how to access the color schemes, see Setting the Color Scheme for the Data Series.
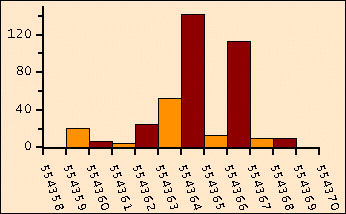
Industry leading stacking charts
Line, Area, Bar, Radar, and Plot charts can be stacked to display more complex data in a smaller space.
For more information on stacking charts, see Line and XY-Plot Charts.
Add visual appeal to your data analysis
Add data highlighting, trend lines, and alarm zones to your charts to create a more effective and readable data chart.
For more information on trend lines, see Working with TrendLines.
For more information on alarm zones, see Alarm Zones.
Invert axes using one property
Enables you to invert the X and Y axis using one simple property.
For more information on inverted axes, see Inverted and Reversed Chart Axes.
Highly interactive behavior at run time drives up value in chart use
C1Chart provides interactive built-in tools for rotation, scaling, and zooming. Using these tools, you can build highly-interactive charts for your users.
For more information on end-user interaction behaviors, see Rotating, Scaling, Translating, and Zooming.
C1Chart provides flexible image formats for chart rendering
Charts can be saved to any number of image formats (metafile, BMP, JPG, and more).
For more information on saving charts, see Loading and Saving Charts, Data, and Images.
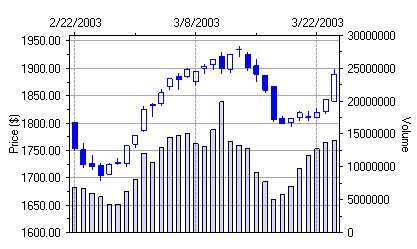
Create a dramatic data presentation by combining multiple chart types into a single chart
Create an area-scatter combination chart or a bar-candle combination chart. Include a wealth of information in a single chart by combining multiple chart types.
Rotate annotations when working in a confined space
When working with larger annotations, you can rotate the annotation to arbitrary angles so that text does not overlap.
For more information on annotation rotation, see Axis Annotation Rotation.
Add symbols such as stars, diamonds, squares and more to represent different series of data for Line, Scatter, Step, and Polar/Radar charts
Choose from a large selection of symbol types such as star, diamond, square, and circle to represent different series of data. Customize the symbols color and size to make it truly unique from each series.
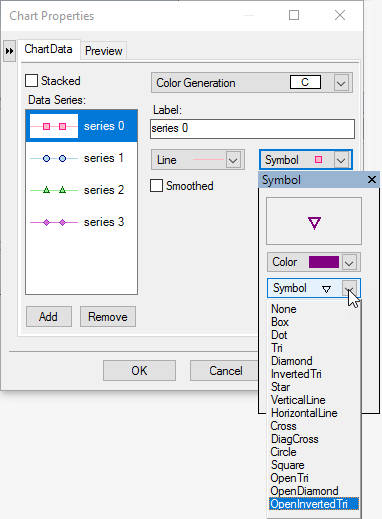
For more information on how to add symbols to a particular data series, see Add Symbols to Data Series.
Built-in engine to help plot advanced functions
The C1Chart control includes a FunctionBase Collection editor to help you create and edit functions for plotting explicit and parametric functions.
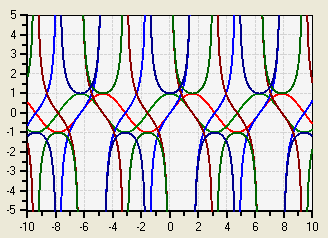
For more information on using functions for plotting data, see Plotting Functions.
Hide and exclude series to create custom charts such as floating bars
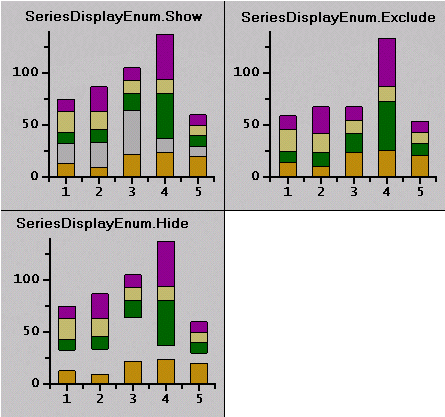
For more information on excluding and hiding data series, see Showing, Excluding, or Hiding a Series.
Automatic creation of data labels
C1Chart provides automatic creation for data labels through the DataLabel property. DataLabel supports a number of keywords (#TEXT, #XVAL, #YVAL, #YVAL1, #YVAL2, #YVAL3) which simplify common data labeling tasks.
For more information on adding data labels, see Add Labels to the Chart.
Flexible and interactive labels
Chart labels and annotations can be positioned anywhere. Multi-line chart labels are unlimited and can be attached to data displayed in the graph or to graph or pixel coordinates.
For more information on using different attachment methods, see Attach Chart Labels.
ToolTips for chart elements
Highlight important information on C1Chart's elements using its ToolTipText property.
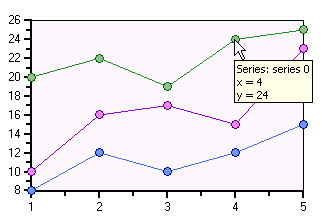
For more information on how to add ToolTips to chart elements, see Add ToolTips to Chart Elements.
Custom brushes
Use a brush for more unique appearance, including hatching, gradients, and textures.
For more information on creating custom hatched and gradient brushes, see Custom Brushes for Plotting Data.
Advanced mouse tracking capabilities
Provides a set of conversion methods that when used in conjunction with .NET's MouseMove event allow the programmer to keep track of the chart's region, series, or data point under the mouse pointer. This makes it easier to create interesting application specific features like handling a double-click in the legend, or chart tool tips.
For more information on C1Chart's conversion methods, see Coordinate Conversion Methods.