


- Blazor Overview
- Get Started with Blazor
- Free and Open Source Software (FOSS) License
- Section 508 Compliance
- Blazor Project Types
- Adding NuGet Packages to your App
- Controls
- Release History
Render Chart and Diagram
Blazor FlexChart and FlexDiagram support rendering chart and diagram content to document, raster, and Scalable Vector Graphics (SVG) output through the IRendering interface.
The Render extension method renders chart or diagram content into an IRendering target, which determines the output format. The rendering workflow applies to FlexChart, FlexPie, FlexRadar, TreeMap, Sunburst, and FlexDiagram. The Render method is also available to platform-specific FlexChart and FlexDiagram controls that implement IChartBase.
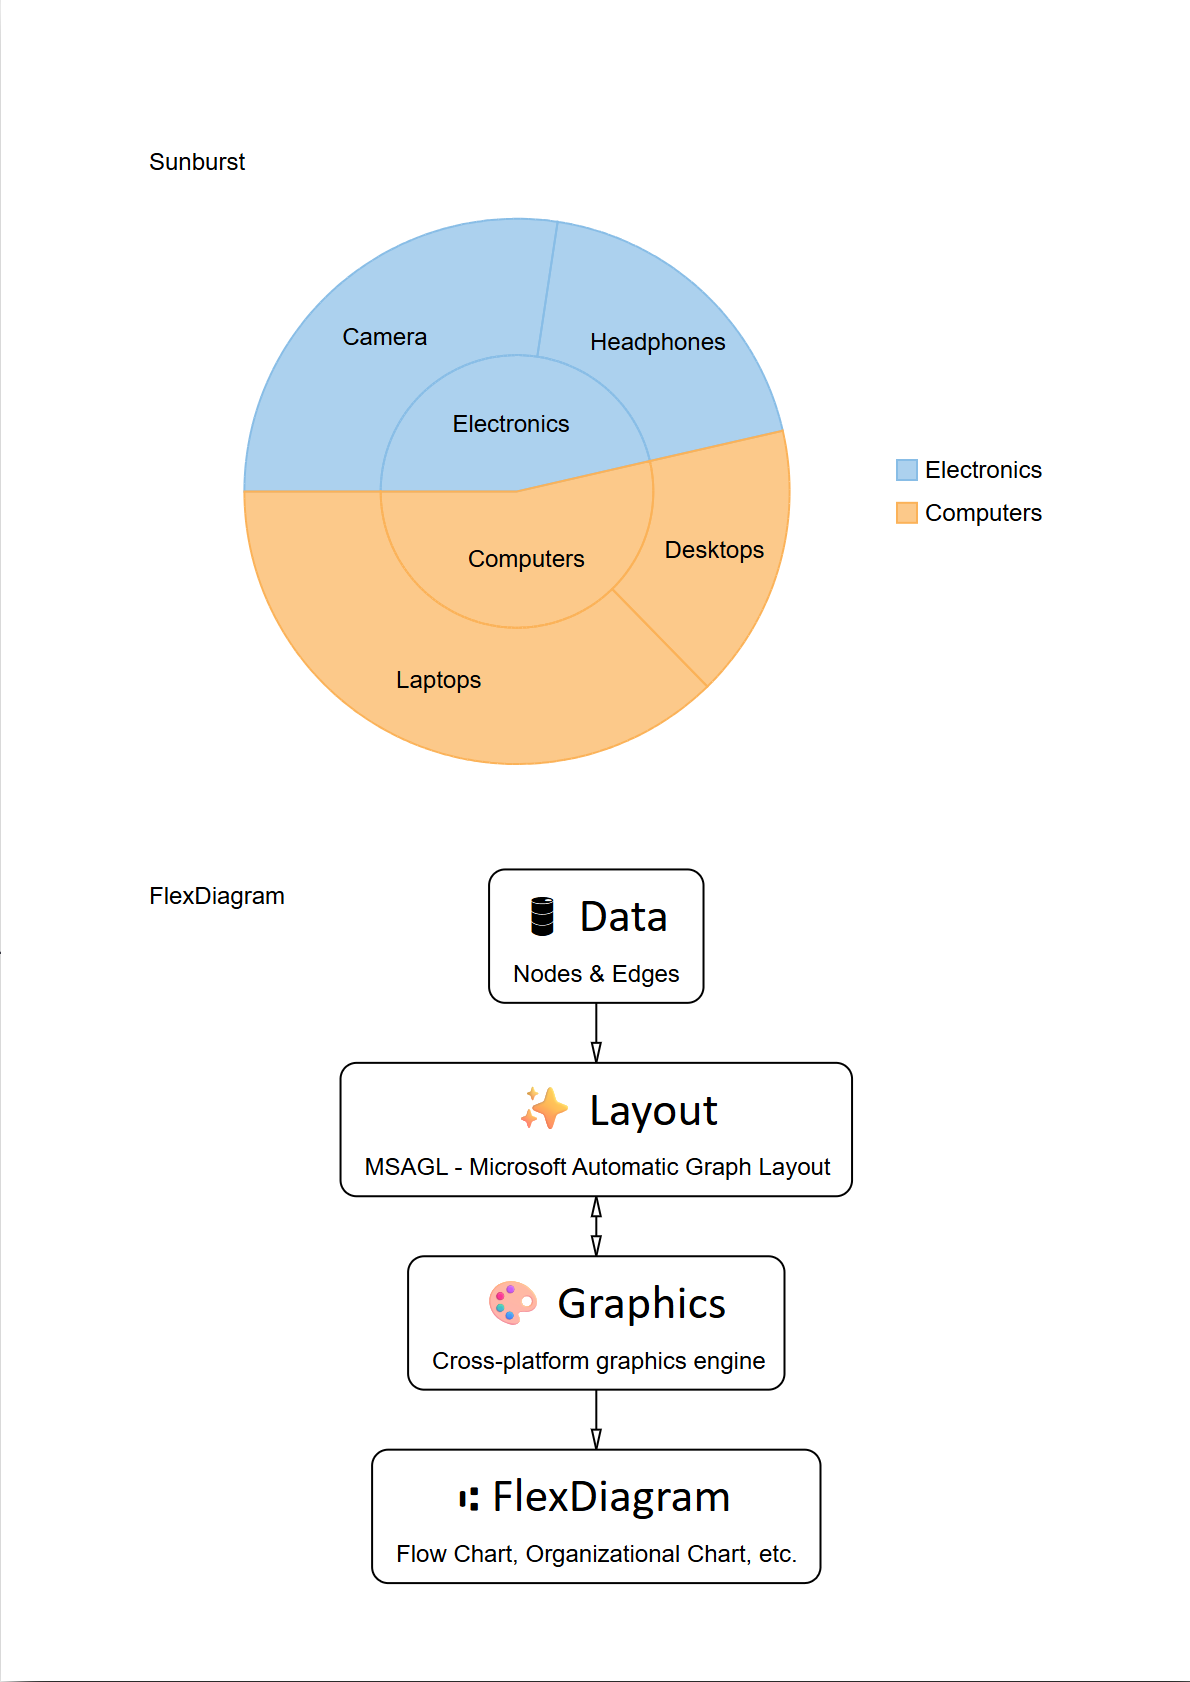
The following image shows rendered output for a Sunburst chart and FlexDiagram.
Prerequisites
The rendering workflow requires C1.Chart version 10.0.20262.107 or later.
The application must reference the appropriate FlexChart or FlexDiagram component package and the library containing the required rendering target.
Output Format | Required NuGet Package |
|---|---|
DOCX / RTF | |
PNG | |
SVG |

The Render extension method is available through the C1.Chart namespace.
Note: WinForms applications may reference C1.Win.Pdf as the platform-specific PDF package.
Output Formats
The Render method supports the following rendering targets.
Output Format | Rendering Target | Rendering Type |
|---|---|---|
C1PdfDocument | Vector | |
DOCX / RTF | C1WordDocument | Vector |
PNG | BitmapGraphicsRendering | Raster |
SVG | SvgGraphicsRendering | Vector |
SVG | SvgRendering | Vector |
The method accepts an IRendering target and a rectangle that specifies the position and dimensions of the rendered content.
chart.Render(target, x, y, width, height);The rectangle coordinates and dimensions are specified in points.