


- Getting Started
-
Topics
- Wijmo
-
Chart
- Basic
-
Advanced
- Animation
- Annotations
- Conditional Formatting
- Data Labels
- Export
- Grouping and Drilldown
- Hit-Testing
- Interpolating Nulls
- Legend and Titles
- Line Markers
- Plot Areas
- Range Selectors
- Selection
- Sorting & Filtering
- Styling Series
- Toggle Series Visibility
- Tooltips
- Zooming
- SpecialCharts
- Axes
- Financial
- Analytics
- Map
- Cloud
- Gauge
- Grid
- OLAP
- Input
- Nav
- Viewer
- Tutorials
Box & Whisker Series
The wijmo.chart.analytics module contains classes that extend the Series class to provide extra information about the data including: trend lines, moving averages, error bars, box and waterfall plots, and function plots.
Box & Whisker charts (AKA boxplots) are normally used to compare distributions between different sets of numerical data. The box and whiskers show groups of numerical data through their quartiles. They have lines extending vertically from the boxes (whiskers) indicating variability outside the upper and lower quartiles.
To create a Box and Whisker chart, follow these steps:
Create one or more BoxWhisker series objects,
Configure the BoxWhisker series by setting their name and binding properties (they should be bound to properties that contain number arrays), and
Set additional properties such as groupWidth and gapWidth if you want to fine-tune the display.
import * as chart from '@mescius/wijmo.chart';
import * as analytics from '@mescius/wijmo.chart.analytics';

// create BoxWhisker series for 'sales' and add it to the chart
var sales = new analytics.BoxWhisker();
sales.name = 'Sales';
sales.binding = 'sales';
sales.groupWidth = .7;
sales.gapWidth = .2;
sales.showInnerPoints = true,
myChart.series.push(sales);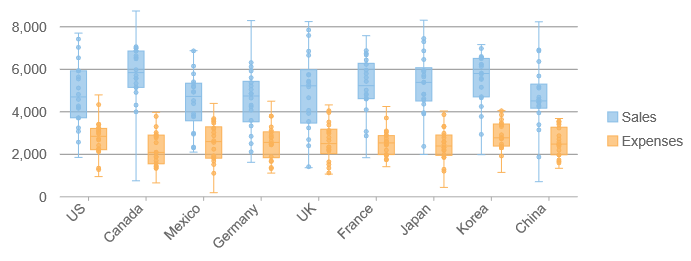
Using Pre-Processed Statistics
By default, the BoxWhisker series expects each bound data point to contain a number array. During rendering, the series calculates the box plot statistics (minimum, maximum, quartiles, median, mean, and outliers) from that array.
If these statistics are already available, you can provide them through the boxPlotData property. When set, the series renders each box from the supplied statistics instead of deriving them from the bound number array.
This is useful in scenarios where statistics are computed in advance, such as on the server or during preprocessing, particularly when working with large datasets.
Binding Processed Statistics
The boxPlotData property accepts an array of objects that represent the final statistics for each rendered box.
For simple array-backed data without view reordering, each entry corresponds to the point at the same index in the bound data.
import * as wijmo from '@mescius/wijmo';
import * as chart from '@mescius/wijmo.chart';
import * as analytics from '@mescius/wijmo.chart.analytics';

let view = new wijmo.CollectionView(data);

let salesSeries = new analytics.BoxWhisker({
    name: 'Sales',
    binding: 'sales',
    groupWidth: 0.7,
    gapWidth: 0.2,
    boxPlotData: data.map(item => item.salesBoxPlotData)
});

let theChart = new chart.FlexChart('#theChart', {
    itemsSource: view,
    bindingX: 'country'
});

theChart.series.push(salesSeries);

view.sortDescriptions.push(new wijmo.SortDescription('country', true));
The supplied statistics are treated as final values.
A boxPlotData entry must include valid values for min, max, firstQuartile, thirdQuartile, and median. If any required value is missing, the entry is treated as invalid and the series reverts to the default raw-array calculation for that point.
Fallback Behavior
If a boxPlotData entry:
Is
nullorundefinedIs missing required numeric values
Does not exist for a rendered point
The series falls back to the default calculation from the bound sample array for that point.
If boxPlotData is not set, the series behaves as usual.
Using with CollectionView
When the series is bound to a CollectionView, processed statistics are associated with items in the underlying sourceCollection by item identity and resolved against the current view during rendering.
View Changes
Operations that only affect the view—such as sorting, filtering, or paging—do not require updating boxPlotData. The processed statistics remain aligned automatically.
Source Data Changes
When the underlying source data changes:
Removed items — Remaining items stay aligned automatically.
Added items — If newly added items do not have corresponding entries in
boxPlotData, those points fall back to the default raw-array calculation path. To use processed statistics for new items, updateboxPlotDataaccordingly.ReReplaced items (new object instances) — Because alignment is based on item identity, replacing source items requires resetting
boxPlotDatato maintain correct mapping.
If a rendered item does not have a matching processed statistics entry, the series uses the default calculation from the bound raw data for that point.
Notes:
The series still requires its bound raw data property (for example,
sales).The
boxPlotDataproperty replaces only the per-point statistics calculation and does not replace the standard series binding pipeline.
Additional Box & Whisker Options
Set these additional properties to fine-tune the display.
gapWidth: The width of the gap between groups as a percentage. The default value is 0.1. The min value is 0 and max value is 1.
groupWidth: The box group width as a percentage. The default value for this property is 0.8. The min value is 0 and the max value is 1.
QuartileCalculation: Specifies the quartile calculation method. Options include InclusiveMedian and ExclusiveMedian, which includes or excludes the median value when calculating the quartile.
showMeanLine: Determines whether to show the mean line.
showMeanMarker: Determines whether to show the mean marker.
showOutliers: Determines whether to show outliers. Outliers are inner points outside the range between the first and third quartiles.
Styling the Box & Whisker Series
The BoxWhisker series supports the same style option as other series in FlexChart. In addition to style, BoxWhisker includes some special style properties for the mean line and markers.
import * as chart from '@mescius/wijmo.chart';
import * as analytics from '@mescius/wijmo.chart.analytics';

var sales = new analytics.BoxWhisker();
sales.name = 'Sales';
sales.binding = 'sales';
sales.meanLineStyle = {
    stroke:'darkgreen',
    strokeWidth: 1};
sales.meanMarkerStyle = {
    fill:'red',
    stroke:'darkred',
    strokeWidth: 1};
myChart.series.push(sales);