- Getting Started
-
Topics
- Wijmo
-
Chart
- Basic
-
Advanced
- Animation
- Annotations
- Conditional Formatting
- Data Labels
- Export
- Grouping and Drilldown
- Hit-Testing
- Interpolating Nulls
- Legend and Titles
- Line Markers
- Plot Areas
- Range Selectors
- Selection
- Sorting & Filtering
- Styling Series
- Toggle Series Visibility
- Tooltips
- Zooming
- SpecialCharts
- Axes
- Financial
- Analytics
- Map
- Cloud
- Gauge
- Grid
- OLAP
- Input
- Nav
- Viewer
Legend & Titles in FlexChart
Setting the Legend Title & Position
Use the legend's properties to customize the appearance of the chart legend.
position: Determines whether and where the legend appears in relation to the plot area. The value should be 'Auto','TopLeft', 'TopRight', 'BottomLeft', 'BottomRight', 'LeftTop', 'LeftBottom', 'RightTop', 'RightBottom', 'Left', 'Right', 'Top', 'Bottom', or 'None'.
title: The title text for the legend.
titleAlign: Determines the align value of the legend title. The value should be 'left', 'center' or 'right'.
reverse: Gets or sets a value that determines whether the legend would be shown in reverse order or not. The value should be 'true' or 'false' or undefined. Default value is undefined.
To hide the legend, set its position to 'None'.
Setting the Header, Footer & Axis Titles
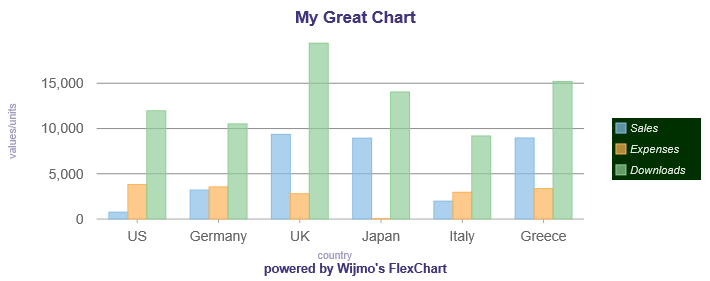
Add some text labels to the chart by setting the header, footer and axis titles.
import * as chart from '@mescius/wijmo.chart';

var myChart = new chart.FlexChart('#myChart');
myChart.header = 'Sample Chart';
myChart.footer = 'copyright (c) ComponentOne';
myChart.axisX.title = 'country';
myChart.axisY.title = 'amount';
Styling the Legend & Titles by CSS
You can style the legend and titles using CSS. The CSS example below shows the rules used to customize the appearance of the legend and titles. Notice that these are SVG elements, so you have to use CSS attributes such as "fill" instead of "color."
Header, Footer & Axis Titles Example:
/* custom color for all titles */
.wj-flexchart .wj-title {
  fill: #42357C;
}

/* custom size/weight for header */
.wj-flexchart .wj-header .wj-title {
  font-size: 120%;
  font-weight: bold;
}

/* custom size/weight for footer */
.wj-flexchart .wj-footer .wj-title {
  font-size: 90%;
  font-weight: bold;
}

/* custom style for axis-x/y titles */
.wj-flexchart .wj-axis-x .wj-title,
.wj-flexchart .wj-axis-y .wj-title{
  font-size: 75%;
  font-style: normal;
  opacity: .5;
}
Legend Example:
/* custom color for legend box */
.wj-flexchart .wj-legend > rect {
  fill: #003000;
}

/* custom color for legend labels */
.wj-flexchart .wj-legend .wj-label {
  fill: white;
  opacity: .9;
  font-size: 80%;
  font-style: italic;
}


