
-
Spread Windows Forms Product Documentation
- Getting Started
-
Developer's Guide
- Understanding the Product
- Working with the Component
- Spreadsheet Objects
- Ribbon Control
- Sheets
- Rows and Columns
- Headers
- Cells
- Cell Types
- Data Binding
- Customizing the Sheet Appearance
- Customizing Interaction in Cells
- Tables
- Pivot Table
- Understanding the Underlying Models
- Customizing Row or Column Interaction
- Formulas in Cells
- Sparklines
- Keyboard Interaction
- Events from User Actions
- File Operations
- Storing Excel Summary and View
- Printing
- Chart Control
- Enhanced Chart
- Customizing Drawing
- Touch Support with the Component
- Spread Designer Guide
- Assembly Reference
- Import and Export Reference
- Version Comparison Reference
Legend
A legend entry in a chart refers to the name of the data category plotted on the chart. The primary objective of adding legends to a chart is to help readers understand the plotted information and analyze the data. You can define legends in charts to show descriptions of the data contained in the rows and columns of a worksheet.
To configure chart legends, use the Legend property of the IChart interface. Additionally, use the properties of the ILegend interface to edit chart legends' display status, position, alignment, etc. For example, setting the IncludeInLayout property to true or false allows you to determine whether the legend is shown or hidden in the chart. The default value for this property is true.
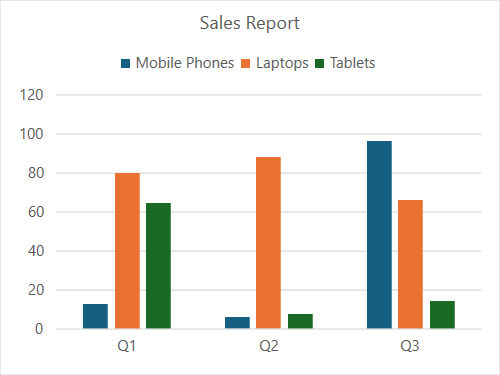
The following example code customizes the legends’ position at the top of the chart and included in the layout for better visibility.
C#
fpSpread1.Features.EnhancedShapeEngine = true;
fpSpread1.Features.EnhancedChartEngine = true;
fpSpread1.AsWorkbook().ActiveSheet.Cells[0, 1].Value = "Q1";
fpSpread1.AsWorkbook().ActiveSheet.Cells[0, 2].Value = "Q2";
fpSpread1.AsWorkbook().ActiveSheet.Cells[0, 3].Value = "Q3";
fpSpread1.AsWorkbook().ActiveSheet.Cells[1, 0].Value = "Mobile Phones";
fpSpread1.AsWorkbook().ActiveSheet.Cells[2, 0].Value = "Laptops";
fpSpread1.AsWorkbook().ActiveSheet.Cells[3, 0].Value = "Tablets";
Random random = new Random();
for (var r = 1; r <= 3; r++)
{
    for (var c = 1; c <= 3; c++)
    {
        fpSpread1.AsWorkbook().ActiveSheet.Cells[r, c].Value = 0 + random.Next(0, 100);
    }
}
fpSpread1.AsWorkbook().ActiveSheet.Cells["A1:D4"].Select();
fpSpread1.AsWorkbook().ActiveSheet.Shapes.AddChart(GrapeCity.Spreadsheet.Charts.ChartType.ColumnClustered, 100, 150, 400, 300, true);
fpSpread1.AsWorkbook().ActiveSheet.ChartObjects[0].Chart.ChartTitle.Text = "Sales Report";
var legend = fpSpread1.AsWorkbook().ActiveSheet.ChartObjects[0].Chart.Legend;
legend.Position = LegendPosition.Top;
legend.IncludeInLayout = true;
VB
fpSpread1.Features.EnhancedShapeEngine = True
fpSpread1.Features.EnhancedChartEngine = True
fpSpread1.AsWorkbook().ActiveSheet.Cells(0, 1).Value = "Q1"
fpSpread1.AsWorkbook().ActiveSheet.Cells(0, 2).Value = "Q2"
fpSpread1.AsWorkbook().ActiveSheet.Cells(0, 3).Value = "Q3"
fpSpread1.AsWorkbook().ActiveSheet.Cells(1, 0).Value = "Mobile Phones"
fpSpread1.AsWorkbook().ActiveSheet.Cells(2, 0).Value = "Laptops"
fpSpread1.AsWorkbook().ActiveSheet.Cells(3, 0).Value = "Tablets"
Dim random As New Random()
For r As Integer = 1 To 3
    For c As Integer = 1 To 3
        fpSpread1.AsWorkbook().ActiveSheet.Cells(r, c).Value = 0 + random.Next(0, 100)
    Next
Next
fpSpread1.AsWorkbook().ActiveSheet.Cells("A1:D4").Select()
fpSpread1.AsWorkbook().ActiveSheet.Shapes.AddChart(GrapeCity.Spreadsheet.Charts.ChartType.ColumnClustered, 100, 150, 400, 300, True)
fpSpread1.AsWorkbook().ActiveSheet.ChartObjects(0).Chart.ChartTitle.Text = "Sales Report"
Dim legend = fpSpread1.AsWorkbook().ActiveSheet.ChartObjects(0).Chart.Legend
legend.Position = LegendPosition.Top
legend.IncludeInLayout = True
Show/Hide Legend Entries
You can use the ILegend.Delete() method to hide a specific legend entry for enhanced charts.
When you call the IChart.ShowLegend() method, all legend entries in the chart are displayed by default. You can then use the ILegend.Delete() method to hide specific legend entries, providing more flexibility in customizing the legend display.
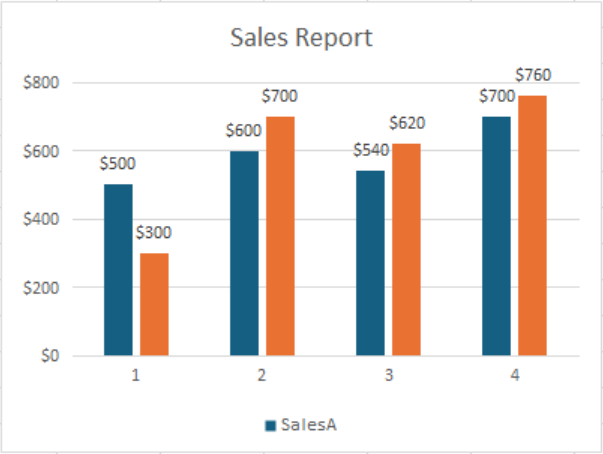
The following example demonstrates how to hide a specific legend entry for enhanced charts.
C#
// Enable enhanced shape and chart engines.
fpSpread1.Features.EnhancedShapeEngine = true;
fpSpread1.Features.EnhancedChartEngine = true;

// Set data.
fpSpread1.Sheets[0].Cells[0, 0].Text = "SalesA";
fpSpread1.Sheets[0].Cells[0, 1].Text = "SalesB";
fpSpread1.Sheets[0].Cells[1, 0].Value = 500;
fpSpread1.Sheets[0].Cells[2, 0].Value = 600;
fpSpread1.Sheets[0].Cells[3, 0].Value = 540;
fpSpread1.Sheets[0].Cells[4, 0].Value = 700;
fpSpread1.Sheets[0].Cells[1, 1].Value = 300;
fpSpread1.Sheets[0].Cells[2, 1].Value = 700;
fpSpread1.Sheets[0].Cells[3, 1].Value = 620;
fpSpread1.Sheets[0].Cells[4, 1].Value = 760;

// Set Sales column to currency format.
fpSpread1.Sheets[0].AsWorksheet().Cells[0, 0, 5, 2].NumberFormat = "$#,##0";
fpSpread1.Sheets[0].SetActiveCell(1, 0);
fpSpread1.Sheets[0].AddSelection(0, 0, 5, 2);

// Add a ColumnClustered chart.
fpSpread1.AsWorkbook().ActiveSheet.Shapes.AddChart(GrapeCity.Spreadsheet.Charts.ChartType.ColumnClustered, 100, 150, 400, 300);
var chart = fpSpread1.AsWorkbook().ActiveSheet.ChartObjects[0].Chart;
chart.ApplyDataLabels(DataLabelVisibilities.Value);
chart.ChartTitle.Text = "Sales Report";

// Display chart legend.
fpSpread1.AsWorkbook().ActiveSheet.ChartObjects[0].Chart.ShowLegend();

// Hide specific legend.
fpSpread1.AsWorkbook().ActiveSheet.ChartObjects[0].Chart.Legend.LegendEntries[1].Delete();
VB
' Enable enhanced shape and chart engines.
fpSpread1.Features.EnhancedShapeEngine = True
fpSpread1.Features.EnhancedChartEngine = True

' Set data.
fpSpread1.Sheets(0).Cells(0, 0).Text = "SalesA"
fpSpread1.Sheets(0).Cells(0, 1).Text = "SalesB"
fpSpread1.Sheets(0).Cells(1, 0).Value = 500
fpSpread1.Sheets(0).Cells(2, 0).Value = 600
fpSpread1.Sheets(0).Cells(3, 0).Value = 540
fpSpread1.Sheets(0).Cells(4, 0).Value = 700
fpSpread1.Sheets(0).Cells(1, 1).Value = 300
fpSpread1.Sheets(0).Cells(2, 1).Value = 700
fpSpread1.Sheets(0).Cells(3, 1).Value = 620
fpSpread1.Sheets(0).Cells(4, 1).Value = 760

' Set Sales column to currency format.
fpSpread1.Sheets(0).AsWorksheet().Cells(0, 0, 5, 2).NumberFormat = "$#,##0"
fpSpread1.Sheets(0).SetActiveCell(1, 0)
fpSpread1.Sheets(0).AddSelection(0, 0, 5, 2)

' Add a ColumnClustered chart.
fpSpread1.AsWorkbook().ActiveSheet.Shapes.AddChart(GrapeCity.Spreadsheet.Charts.ChartType.ColumnClustered, 100, 150, 400, 300)
Dim chart = fpSpread1.AsWorkbook().ActiveSheet.ChartObjects(0).Chart
chart.ApplyDataLabels(DataLabelVisibilities.Value)
chart.ChartTitle.Text = "Sales Report"

' Display chart legend.
fpSpread1.AsWorkbook().ActiveSheet.ChartObjects(0).Chart.ShowLegend()

' Hide specific legend.
fpSpread1.AsWorkbook().ActiveSheet.ChartObjects(0).Chart.Legend.LegendEntries(1).Delete()