
-
Spread Windows Forms Product Documentation
- Getting Started
-
Developer's Guide
- Understanding the Product
- Working with the Component
- Spreadsheet Objects
- Ribbon Control
- Sheets
- Rows and Columns
- Headers
- Cells
- Cell Types
- Data Binding
- Customizing the Sheet Appearance
- Customizing Interaction in Cells
- Tables
- Pivot Table
- Understanding the Underlying Models
- Customizing Row or Column Interaction
- Formulas in Cells
- Sparklines
- Keyboard Interaction
- Events from User Actions
- File Operations
- Storing Excel Summary and View
- Printing
- Chart Control
- Enhanced Chart
- Customizing Drawing
- Touch Support with the Component
- Spread Designer Guide
- Assembly Reference
- Import and Export Reference
- Version Comparison Reference
Chart Styles
All charts in Spread Windows Forms come with a default style. However, you can also customize the appearance of the enhanced chart by applying a predefined style that meets your requirements. There are a wide range of styles available for different charts.
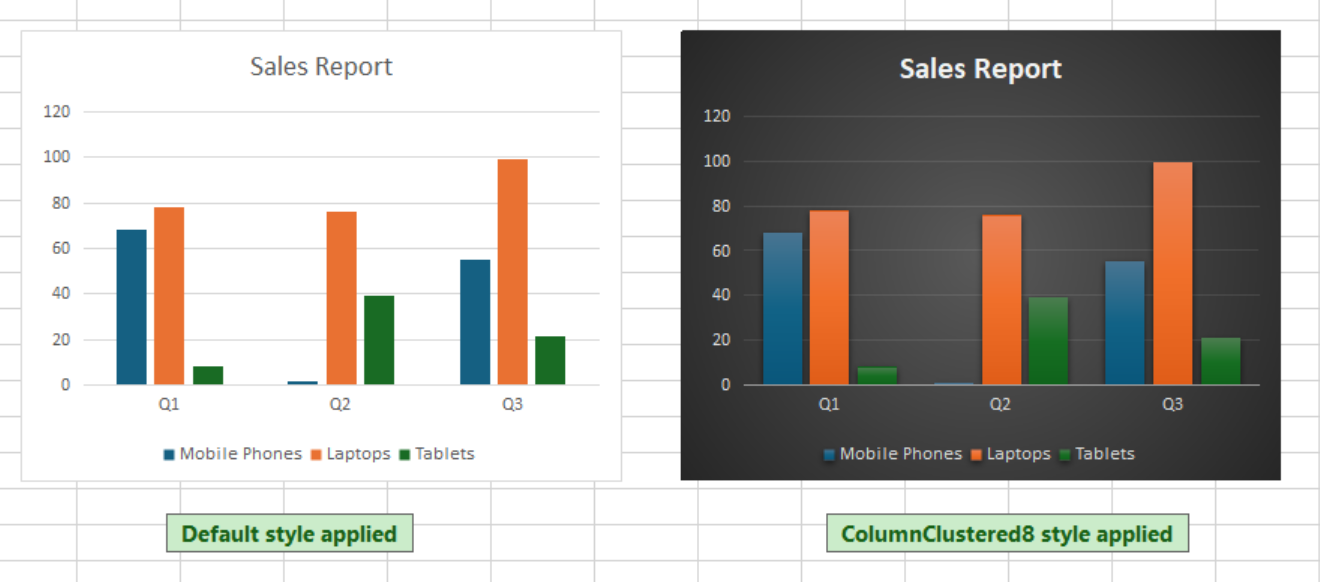
Note: If no specific style is set, the default style for that particular chart type is automatically applied.
Setting a Chart Style
To apply a predefined style to your chart, you can use the ChartStyle property of the IChart interface. This property returns a value of BuiltInChartStyles enumeration of the GrapeCity.Spreadsheet.Charts namespace.
The following example demonstrates how to set the style for an enhanced chart.
C#
// Enable enhanced shape and chart engines.
fpSpread1.Features.EnhancedShapeEngine = true;
fpSpread1.Features.EnhancedChartEngine = true;
// Set data.
fpSpread1.AsWorkbook().ActiveSheet.Cells[0, 1].Value = "Q1";
fpSpread1.AsWorkbook().ActiveSheet.Cells[0, 2].Value = "Q2";
fpSpread1.AsWorkbook().ActiveSheet.Cells[0, 3].Value = "Q3";
fpSpread1.AsWorkbook().ActiveSheet.Cells[1, 0].Value = "Mobile Phones";
fpSpread1.AsWorkbook().ActiveSheet.Cells[2, 0].Value = "Laptops";
fpSpread1.AsWorkbook().ActiveSheet.Cells[3, 0].Value = "Tablets";
Random random = new Random();
for (var r = 1; r <= 3; r++)
{
    for (var c = 1; c <= 3; c++)
    {
        fpSpread1.AsWorkbook().ActiveSheet.Cells[r, c].Value = random.Next(0, 100);
    }
}
fpSpread1.AsWorkbook().ActiveSheet.Cells["A1:D4"].Select();
// Add ColumnClustered chart.
fpSpread1.AsWorkbook().ActiveSheet.Shapes.AddChart(GrapeCity.Spreadsheet.Charts.ChartType.ColumnClustered, 540, 150, 400, 300, true);
// Apply chart style.
fpSpread1.AsWorkbook().ActiveSheet.ChartObjects[0].Chart.ChartStyle = GrapeCity.Spreadsheet.Charts.BuiltInChartStyles.ColumnClustered8;
fpSpread1.AsWorkbook().ActiveSheet.ChartObjects[0].Chart.ChartTitle.Text = "Sales Report";
VB
' Enable enhanced shape and chart engines.
fpSpread1.Features.EnhancedShapeEngine = True
fpSpread1.Features.EnhancedChartEngine = True
' Set data.
fpSpread1.AsWorkbook().ActiveSheet.Cells(0, 1).Value = "Q1"
fpSpread1.AsWorkbook().ActiveSheet.Cells(0, 2).Value = "Q2"
fpSpread1.AsWorkbook().ActiveSheet.Cells(0, 3).Value = "Q3"
fpSpread1.AsWorkbook().ActiveSheet.Cells(1, 0).Value = "Mobile Phones"
fpSpread1.AsWorkbook().ActiveSheet.Cells(2, 0).Value = "Laptops"
fpSpread1.AsWorkbook().ActiveSheet.Cells(3, 0).Value = "Tablets"
Dim rnd As New Random()
For r As Integer = 1 To 3
    For c As Integer = 1 To 3
        fpSpread1.AsWorkbook().ActiveSheet.Cells(r, c).Value = rnd.Next(0, 100)
    Next
Next
fpSpread1.AsWorkbook().ActiveSheet.Cells("A1:D4").Select()
' Add ColumnClustered chart.
fpSpread1.AsWorkbook().ActiveSheet.Shapes.AddChart(GrapeCity.Spreadsheet.Charts.ChartType.ColumnClustered, 540, 150, 400, 300, True)
' Apply chart style.
fpSpread1.AsWorkbook().ActiveSheet.ChartObjects(0).Chart.ChartStyle = GrapeCity.Spreadsheet.Charts.BuiltInChartStyles.ColumnClustered8
fpSpread1.AsWorkbook().ActiveSheet.ChartObjects(0).Chart.ChartTitle.Text = "Sales Report"