
-
Spread Windows Forms Product Documentation
- Getting Started
-
Developer's Guide
- Understanding the Product
- Working with the Component
- Spreadsheet Objects
- Ribbon Control
- Sheets
- Rows and Columns
- Headers
- Cells
- Cell Types
- Data Binding
- Customizing the Sheet Appearance
- Customizing Interaction in Cells
- Tables
- Pivot Table
- Understanding the Underlying Models
- Customizing Row or Column Interaction
- Formulas in Cells
- Sparklines
- Keyboard Interaction
- Events from User Actions
- File Operations
- Storing Excel Summary and View
- Printing
- Chart Control
- Enhanced Chart
- Customizing Drawing
- Touch Support with the Component
- Spread Designer Guide
- Assembly Reference
- Import and Export Reference
- Version Comparison Reference
Chart Title
Titles are the text fields that appear on a chart. It provides a descriptive heading for the chart data. You can add the title text to a chart by using the Text property of the IChartTitle interface. You can also adjust alignment, position, height, width, etc. using the various customization options available.
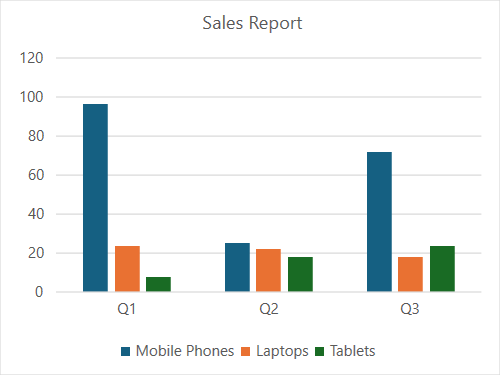
The following example code assigns a title "Sales Report" to the chart and includes it in the layout.
C#
// Enable enhanced shape and chart engines.
fpSpread1.Features.EnhancedShapeEngine = true;
fpSpread1.Features.EnhancedChartEngine = true;

// Set data.
fpSpread1.AsWorkbook().ActiveSheet.Cells[0, 1].Value = "Q1";
fpSpread1.AsWorkbook().ActiveSheet.Cells[0, 2].Value = "Q2";
fpSpread1.AsWorkbook().ActiveSheet.Cells[0, 3].Value = "Q3";
fpSpread1.AsWorkbook().ActiveSheet.Cells[1, 0].Value = "Mobile Phones";
fpSpread1.AsWorkbook().ActiveSheet.Cells[2, 0].Value = "Laptops";
fpSpread1.AsWorkbook().ActiveSheet.Cells[3, 0].Value = "Tablets";
Random random = new Random();
for (var r = 1; r <= 3; r++)
{
   for (var c = 1; c <= 3; c++)
   {
       fpSpread1.AsWorkbook().ActiveSheet.Cells[r, c].Value = 0 + random.Next(0, 100);
   }
}
fpSpread1.AsWorkbook().ActiveSheet.Cells["A1:D4"].Select();
fpSpread1.AsWorkbook().ActiveSheet.Shapes.AddChart(GrapeCity.Spreadsheet.Charts.ChartType.ColumnClustered, 100, 150, 400, 300, true);

// Set Title.
fpSpread1.AsWorkbook().ActiveSheet.ChartObjects[0].Chart.ChartTitle.Text = "Sales Report";
fpSpread1.AsWorkbook().ActiveSheet.ChartObjects[0].Chart.ChartTitle.IncludeInLayout = true;
VB
' Enable enhanced shape and chart engines.
fpSpread1.Features.EnhancedShapeEngine = True
fpSpread1.Features.EnhancedChartEngine = True

' Set data.
fpSpread1.AsWorkbook().ActiveSheet.Cells(0, 1).Value = "Q1"
fpSpread1.AsWorkbook().ActiveSheet.Cells(0, 2).Value = "Q2"
fpSpread1.AsWorkbook().ActiveSheet.Cells(0, 3).Value = "Q3"
fpSpread1.AsWorkbook().ActiveSheet.Cells(1, 0).Value = "Mobile Phones"
fpSpread1.AsWorkbook().ActiveSheet.Cells(2, 0).Value = "Laptops"
fpSpread1.AsWorkbook().ActiveSheet.Cells(3, 0).Value = "Tablets"
Dim random As New Random()
For r As Integer = 1 To 3
    For c As Integer = 1 To 3
        fpSpread1.AsWorkbook().ActiveSheet.Cells(r, c).Value = 0 + random.Next(0, 100)
    Next
Next
fpSpread1.AsWorkbook().ActiveSheet.Cells("A1:D4").Select()
fpSpread1.AsWorkbook().ActiveSheet.Shapes.AddChart(GrapeCity.Spreadsheet.Charts.ChartType.ColumnClustered, 100, 150, 400, 300, True)

' Set Title.
fpSpread1.AsWorkbook().ActiveSheet.ChartObjects(0).Chart.ChartTitle.Text = "Sales Report"
fpSpread1.AsWorkbook().ActiveSheet.ChartObjects(0).Chart.ChartTitle.IncludeInLayout = True
By default, the title is displayed on a chart. If not, use the ShowTitle() method on the chart object which ensures that the title of the chart is visible to the users.
Using the Formula property of the IChartTitle interface, you can also bind data from the worksheet to chart title. It links the title to a specific cell in the worksheet and when you make any changes to the cell, it will automatically reflect in the chart title. Note that users can use the Formula property to bind data to series values and categories as well.
Refer to the following example code to set the chart title to the value of cell A1 in Sheet1.
C#
fpSpread1.AsWorkbook().ActiveSheet.ChartObjects[0].Chart.ShowTitle();
fpSpread1.AsWorkbook().ActiveSheet.ChartObjects[0].Chart.ChartTitle.Formula = "Sheet1!A1";
VB
fpSpread1.AsWorkbook().ActiveSheet.ChartObjects(0).Chart.ShowTitle()
fpSpread1.AsWorkbook().ActiveSheet.ChartObjects(0).Chart.ChartTitle.Formula = "Sheet1!A1"