-
Spread Windows Forms Product Documentation
- Getting Started
- Developer's Guide
- Spread Designer Guide
- Assembly Reference
- Import and Export Reference
- Version Comparison Reference
Field Settings and Value Field Settings
The Field Settings and Value Field Settings dialogs in Designer allow you to fully customize how your pivot table fields are displayed, summarized, and calculated.
Field Settings
Field Settings is mainly used for row or column fields, letting you control subtotals, labels, layout, and grouping/display options.
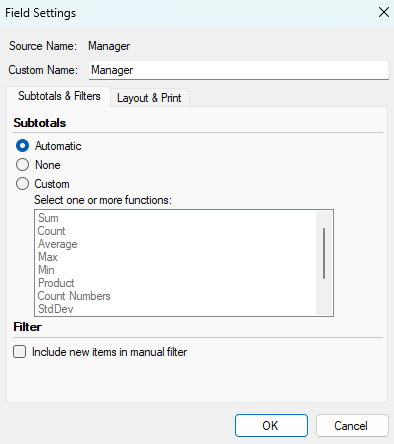
Subtotals and Filters Tab
Options | Description |
|---|---|
Subtotals |
|
Filter | To include or exclude new items when applying a filter in which you have selected specific items in the Filter menu, select or clear the Include new items in manual filter check box. |
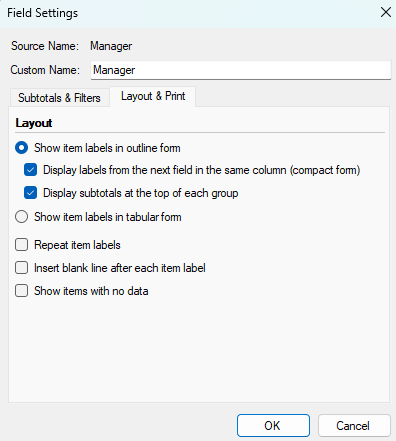
Layout and Print Tab
Options | Description |
|---|---|
Show item labels in outline form |
|
Show item labels in tabular form | Display each field in its own column, providing space for field headers and making the pivot table easier to read and print. |
Repeat item labels | Repeat item labels for each row, making it easier to scan related items (useful when exporting for further analysis). |
Insert blank line after each item label | Add a blank line after each group of items to improve readability. |
Show items with no data | Show all items in the field, even if those items do not have data associated with them in the pivot table. |
Value Field Settings
Value Field Settings focuses on how data values are calculated and shown (including summary methods and value display formats).
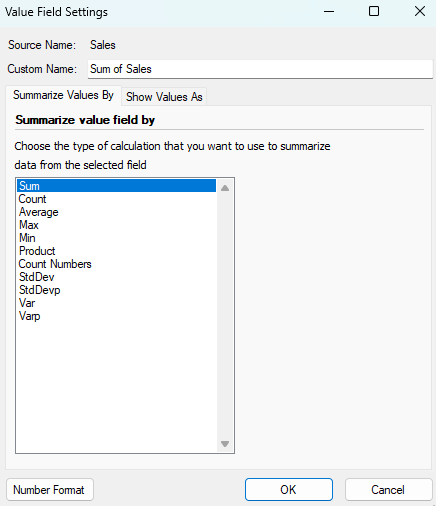
Summarize value field by Tab
In the Summarize value field by box, click the summary function that you want to use.
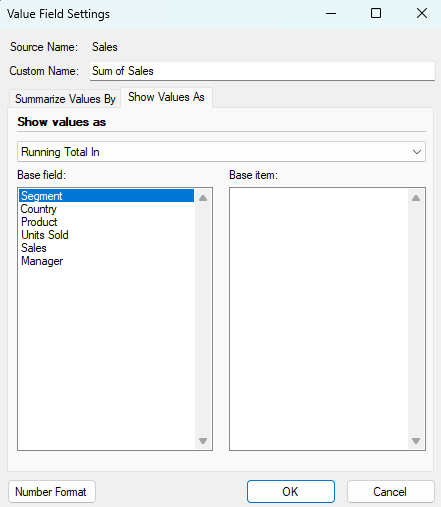
Show Value As Tab
Click the calculation option that you want to use.