- SpreadJS Overview
- Getting Started
- JavaScript Frameworks
- Best Practices
-
Features
- Workbook
- Worksheet
- Rows and Columns
- Headers
- Cells
- Data Binding
- TableSheet
- GanttSheet
- ReportSheet
- Data Charts
- JSON Schema with SpreadJS
- SpreadJS File Format
- Data Validation
- Conditional Formatting
- Sort
- Group
- Formulas
- Serialization
- Keyboard Actions
- Shapes
- Floating Objects
- Barcodes
- Charts
- Sparklines
- Tables
- Pivot Table
- Slicer
- Theme
- User Management
- Culture
- AI Assistant
- SpreadJS Designer
- Tutorials
- SpreadJS Designer Component
- SpreadJS Collaboration Server
- Touch Support
- Formula Reference
- Import and Export Reference
- Frequently Used Events
- API Documentation
- Release Notes
Legend
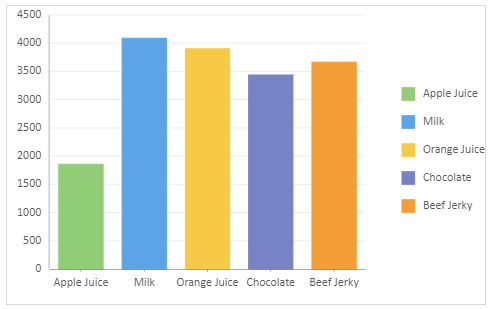
Legend in Data Charts is a visual aid that helps users understand what each line, bar, or other data by associating them with different colors and sizes.
Use the ILegendOptions interface to define the appearance and behavior of a legend in a Data Chart. It includes optional properties such as title, type, position, text style, and many more. Additionally, use the LegendType enumeration to specify the type of legend, such as color or size, whereas LegendPosition enumeration defines where the legend can be positioned in the Data Chart.
The type of symbol displayed for legend depends on the Data Chart type:
Square: Used for bar, area, sunburst, pie, donut, and range charts.
Line: Used for line charts without symbols.
Circle: Used for XY scatter, bubble, and area charts with symbols.
Line with Circle: Used for line charts with symbols.
Legend Properties
The list below shows the key properties of the ILegendOptions interface.
Property | Description | Sample Preview |
|---|---|---|
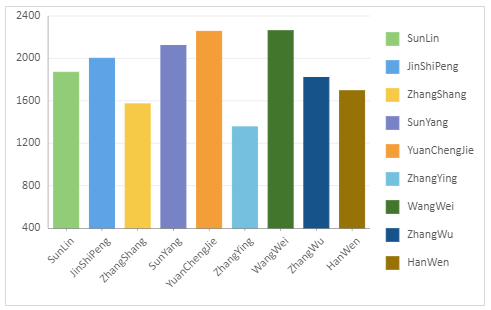
type | Represents data through distinct colors, applicable to all chart types. Color legends appear automatically if fields are bound to the legend in chart encodings. |
|
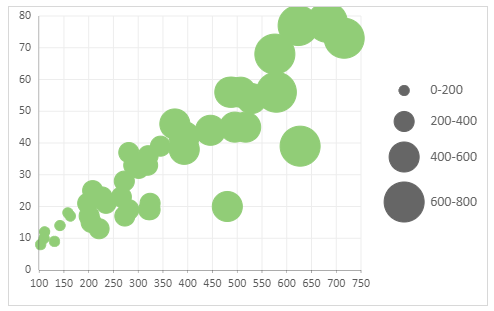
Represents data through varying symbol sizes, typically used in bubble charts. Size legends do not appear by default and require explicit configuration. |
| |
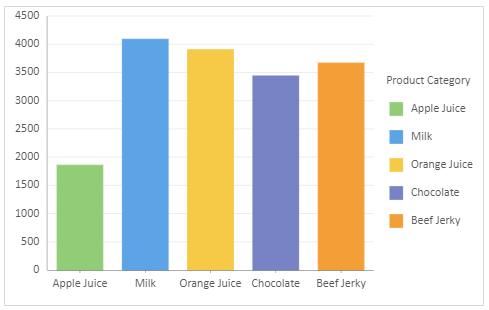
title | Adds a descriptive title to the legend, which describes the meaning or dimension of the content represented in the legend. |
|
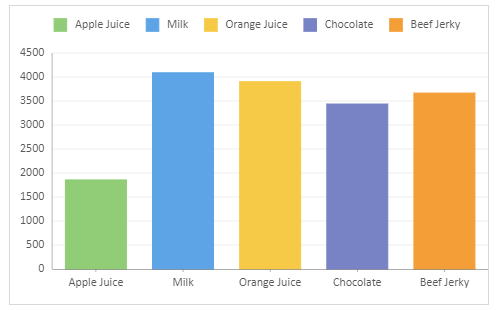
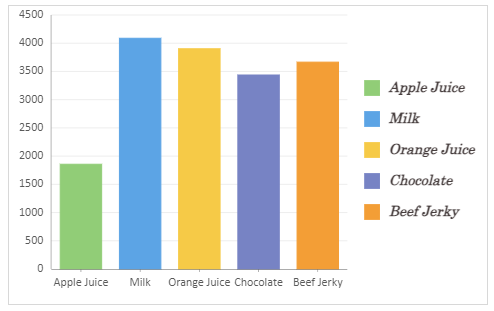
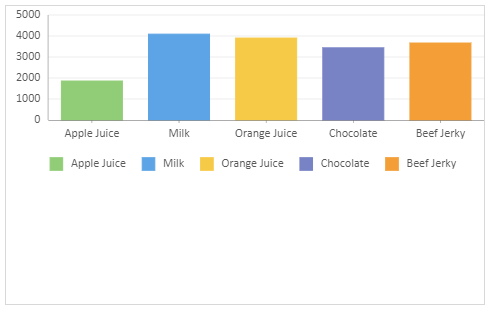
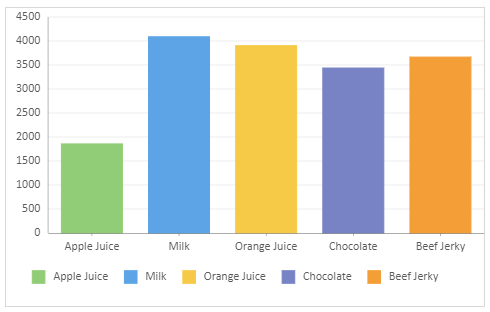
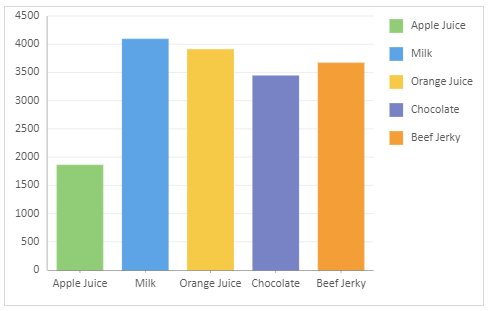
position | Determines where the legend appears in the chart. The available options are None (Default), Top, Bottom, Left, and Right. |
|
textStyle | Defines the appearance of text in the legend area. |
|
height & width | Sets the dimensions of the legend as a percentage of the entire Data Chart, ranging from 0 to 1. |
|
hAlign | Sets horizontal alignment (hAlign) of the legend as Left, Center (Default), or Right. |
|
vAlign | Sets vertical alignment (vAlign) of the legend as Top, Middle (Default), or Bottom. |
|
padding | Adjusts the spacing inside the legend. Default padding is: { top: 10, bottom: 10, left: 10, right: 10 }. |
|
Using Code
The following code sample illustrates how to configure legends for a Data Chart.
Note that this sample uses the "salesTable" data mentioned on the Create Data Charts page. Therefore, make sure you have completed the primary steps outlined on that page to set up a data chart. Once done, you can use the following codes to configure the legends. Additionally, you also have the flexibility to customize the data source according to your specific needs.
// 1. Type
const sheet = spread.getSheet(0);
sheet.setColumnCount(30);
sheet.name("Type");
sheet.setValue(7, 0, "Color Legend");
sheet.setValue(28, 0, "The size legend will not be displayed by default");
sheet.setValue(28, 10, "If you want to display the “size” legend, you need to set the position of the legend.");
// sheet.setValue(23, 0, "Polar coordinate system");
const dataChart = sheet.dataCharts.add('data-chart', 100, 10, 400, 250, GC.Spread.Sheets.DataCharts.DataChartType.column);

// As long as the color legend related fields are bound in the “encodings”,
// the color legend will be shown in the DataChart by default.
dataChart.setChartConfig({
     tableName: 'Sales',
     plots: [
         {
             type: GC.Spread.Sheets.DataCharts.DataChartType.column,
             encodings: {
                 values: [{ field: 'Sales', aggregate: GC.Spread.Sheets.DataCharts.Aggregate.sum }],
                 category: { field: 'Salesman' },
                 color: { field: 'Salesman' },
             },
         }
     ],
});


const dataChart2 = sheet.dataCharts.add('data-chart-2', 10, 300, 400, 259, GC.Spread.Sheets.DataCharts.DataChartType.column);
dataChart2.setChartConfig({
     tableName: 'Sales',
     plots: [
         {
             type: GC.Spread.Sheets.DataCharts.DataChartType.bubble,
             encodings: {
                 values: [
                     { field: 'Sales', aggregate: GC.Spread.Sheets.DataCharts.Aggregate.sum },
                     { field: 'Return', aggregate: GC.Spread.Sheets.DataCharts.Aggregate.sum }
                 ],
                 size: { field: 'Sales', aggregate: GC.Spread.Sheets.DataCharts.Aggregate.sum },
             },
         }
     ],
});

const dataChart3 = sheet.dataCharts.add('data-chart-3', 620, 300, 400, 259, GC.Spread.Sheets.DataCharts.DataChartType.column);
dataChart3.setChartConfig({
     tableName: 'Sales',
     plots: [
         {
             type: GC.Spread.Sheets.DataCharts.DataChartType.bubble,
             encodings: {
                 values: [
                     { field: 'Sales', aggregate: GC.Spread.Sheets.DataCharts.Aggregate.sum },
                     { field: 'Return', aggregate: GC.Spread.Sheets.DataCharts.Aggregate.sum }
                 ],
                 size: { field: 'Sales', aggregate: GC.Spread.Sheets.DataCharts.Aggregate.sum },
             },
         }
     ],
     config: {
         plotAreas: [{
             legends: [{
                 type: GC.Spread.Sheets.DataCharts.LegendType.size,
                 position: GC.Spread.Sheets.DataCharts.LegendPosition.right
             }]
         }]
     }
});

// 2. Title
let sheet2 = spread.getSheet(1);
sheet2.name("Title");
sheet2.setValue(16, 0, "The Legend has title 'Product Category'");
const dataChart4 = sheet2.dataCharts.add('data-chart-4', 10, 10, 480, 300, GC.Spread.Sheets.DataCharts.DataChartType.column);

dataChart4.setChartConfig({
     tableName: 'Sales',
     plots: [
         {
             type: GC.Spread.Sheets.DataCharts.DataChartType.column,
             encodings: {
                 values: [{ field: 'Sales', aggregate: GC.Spread.Sheets.DataCharts.Aggregate.sum }],
                 category: { field: 'Product' },
                 color: { field: 'Product' }
             },
         }
     ],
     config: {
         plotAreas: [{
             legends: [{
                 type: GC.Spread.Sheets.DataCharts.LegendType.color,
                 position: GC.Spread.Sheets.DataCharts.LegendPosition.right,
                 title: "Product Category",
             }]
         }]
     }
});


// 3. Position
let sheet3 = spread.getSheet(2);
sheet3.name("Position");
sheet3.setValue(13, 0, "Legend Position: Right");
sheet3.setValue(30, 0, "Legend Position: Top");
sheet3.setValue(13, 9, "Legend Position: Left");
sheet3.setValue(30, 9, "Legend Position: Bottom");

const dataChart5 = sheet3.dataCharts.add('data-chart-5', 10, 10, 400, 250, GC.Spread.Sheets.DataCharts.DataChartType.column);
dataChart5.setChartConfig({
     tableName: 'Sales',
     plots: [
         {
             type: GC.Spread.Sheets.DataCharts.DataChartType.column,
             encodings: {
                 values: [{ field: 'Sales', aggregate: GC.Spread.Sheets.DataCharts.Aggregate.sum }],
                 category: { field: 'Product' },
                 color: { field: 'Product' }
             },
         }
     ],
     config: {
         plotAreas: [{
             legends: [{
                 type: GC.Spread.Sheets.DataCharts.LegendType.color,
                 position: GC.Spread.Sheets.DataCharts.LegendPosition.right,  // Right Position
             }]
         }]
     }
});
const dataChart6 = sheet3.dataCharts.add('data-chart-6', 550, 10, 400, 250, GC.Spread.Sheets.DataCharts.DataChartType.column);
dataChart6.setChartConfig({
     tableName: 'Sales',
     plots: [
         {
             type: GC.Spread.Sheets.DataCharts.DataChartType.column,
             encodings: {
                 values: [{ field: 'Sales', aggregate: GC.Spread.Sheets.DataCharts.Aggregate.sum }],
                 category: { field: 'Product' },
                 color: { field: 'Product' }
             },
         }
     ],
     config: {
         plotAreas: [{
             legends: [{
                 type: GC.Spread.Sheets.DataCharts.LegendType.color,
                 position: GC.Spread.Sheets.DataCharts.LegendPosition.left, // Left Position
             }]
         }]
     }
});
const dataChart7 = sheet3.dataCharts.add('data-chart-7', 10, 350, 400, 250, GC.Spread.Sheets.DataCharts.DataChartType.column);
dataChart7.setChartConfig({
     tableName: 'Sales',
     plots: [
         {
             type: GC.Spread.Sheets.DataCharts.DataChartType.column,
             encodings: {
                 values: [{ field: 'Sales', aggregate: GC.Spread.Sheets.DataCharts.Aggregate.sum }],
                 category: { field: 'Product' },
                 color: { field: 'Product' }
             },
         }
     ],
     config: {
         plotAreas: [{
             legends: [{
                 type: GC.Spread.Sheets.DataCharts.LegendType.color,
                 position: GC.Spread.Sheets.DataCharts.LegendPosition.top,   // Top Position
             }]
         }]
     }
});
const dataChart8 = sheet3.dataCharts.add('data-chart-8', 550, 350, 400, 250, GC.Spread.Sheets.DataCharts.DataChartType.column);
dataChart8.setChartConfig({
     tableName: 'Sales',
     plots: [
         {
             type: GC.Spread.Sheets.DataCharts.DataChartType.column,
             encodings: {
                 values: [{ field: 'Sales', aggregate: GC.Spread.Sheets.DataCharts.Aggregate.sum }],
                 category: { field: 'Product' },
                 color: { field: 'Product' }
             },
         }
     ],
     config: {
         plotAreas: [{
             legends: [{
                 type: GC.Spread.Sheets.DataCharts.LegendType.color,
                 position: GC.Spread.Sheets.DataCharts.LegendPosition.bottom,  // Bottom Position
             }]
         }]
     }
});

// 4. Text Style
let sheet4 = spread.getSheet(3);
sheet4.name("Text Style");
sheet4.setValue(17, 0, "Legend Text Style has been changed");

const dataChart9 = sheet4.dataCharts.add('data-chart-9', 10, 10, 450, 300, GC.Spread.Sheets.DataCharts.DataChartType.column);
dataChart9.setChartConfig({
     tableName: 'Sales',
     plots: [
         {
             type: GC.Spread.Sheets.DataCharts.DataChartType.column,
             encodings: {
                 values: [{ field: 'Sales', aggregate: GC.Spread.Sheets.DataCharts.Aggregate.sum }],
                 category: { field: 'Product' },
                 color: { field: 'Product' }
             },
         }
     ],
     config: {
         plotAreas: [{
             legends: [{
                 type: GC.Spread.Sheets.DataCharts.LegendType.color,
                 position: GC.Spread.Sheets.DataCharts.LegendPosition.right,
                 textStyle: {
                     color: "#483f3f",
                     fontFamily: "Century",
                     fontSize: 14,
                     fontStyle: GC.Spread.Sheets.DataCharts.FontStyle.italic,
                     fontWeight: "Bold"
                 }
             }]
         }]
     }
});

// 5. Height and Width
let sheet5 = spread.getSheet(4);
sheet5.name("Height and Width");
sheet5.setValue(16, 0, "Height of the Legend: 0.5");
sheet5.setValue(16, 10, "Width of the Legend: 0.4");

const dataChart10 = sheet5.dataCharts.add('data-chart-10', 10, 10, 450, 300, GC.Spread.Sheets.DataCharts.DataChartType.column);
dataChart10.setChartConfig({
     tableName: 'Sales',
     plots: [
         {
             type: GC.Spread.Sheets.DataCharts.DataChartType.column,
             encodings: {
                 values: [{ field: 'Sales', aggregate: GC.Spread.Sheets.DataCharts.Aggregate.sum }],
                 category: { field: 'Product' },
                 color: { field: 'Product' }
             },
         }
     ],
     config: {
         plotAreas: [{
             legends: [{
                 type: GC.Spread.Sheets.DataCharts.LegendType.color,
                 position: GC.Spread.Sheets.DataCharts.LegendPosition.bottom,
                 // Set the height of the legend as a percentage of the entire DataChart.
                 height: 0.5, // Value range is 0~1.
             }]
         }]
     }
});

const dataChart11 = sheet5.dataCharts.add('data-chart-11', 600, 10, 450, 300, GC.Spread.Sheets.DataCharts.DataChartType.column);
 dataChart11.setChartConfig({
     tableName: 'Sales',
     plots: [
         {
             type: GC.Spread.Sheets.DataCharts.DataChartType.column,
             encodings: {
                 values: [{ field: 'Sales', aggregate: GC.Spread.Sheets.DataCharts.Aggregate.sum }],
                 category: { field: 'Product' },
                 color: { field: 'Product' }
             },
         }
     ],
     config: {
         plotAreas: [{
             legends: [{
                 type: GC.Spread.Sheets.DataCharts.LegendType.color,
                 position: GC.Spread.Sheets.DataCharts.LegendPosition.right,
                 // Set the width of the legend as a percentage of the entire DataChart.
                 width: 0.4, // Value range is 0~1.
             }]
         }]
     }
});

 // 6. hAlign
 let sheet6 = spread.getSheet(5);
 sheet6.name("hAlign");
 sheet6.setValue(13, 0, "Horizonal Alignment: Left");
 sheet6.setValue(30, 0, "Horizonal Alignment: Center  (Default Value)");
 sheet6.setValue(13, 9, "Horizonal Alignment: Right");

 const dataChart12 = sheet6.dataCharts.add('data-chart-12', 10, 10, 400, 250, GC.Spread.Sheets.DataCharts.DataChartType.column);
 dataChart12.setChartConfig({
     tableName: 'Sales',
     plots: [
         {
             type: GC.Spread.Sheets.DataCharts.DataChartType.column,
             encodings: {
                 values: [{ field: 'Sales', aggregate: GC.Spread.Sheets.DataCharts.Aggregate.sum }],
                 category: { field: 'Product' },
                 color: { field: 'Product' }
             },
         }
     ],
     config: {
         plotAreas: [{
             legends: [{
                 type: GC.Spread.Sheets.DataCharts.LegendType.color,
                 position: GC.Spread.Sheets.DataCharts.LegendPosition.bottom,
                 padding: {
                     left: 30,
                 },
                 // Set the Horizontal Alignment
                 hAlign: GC.Spread.Sheets.DataCharts.HAlign.left   // Left Position
             }]
         }]
     }
 });

 const dataChart13 = sheet6.dataCharts.add('data-chart-13', 10, 350, 400, 250, GC.Spread.Sheets.DataCharts.DataChartType.column);
 dataChart13.setChartConfig({
     tableName: 'Sales',
     plots: [
         {
             type: GC.Spread.Sheets.DataCharts.DataChartType.column,
             encodings: {
                 values: [{ field: 'Sales', aggregate: GC.Spread.Sheets.DataCharts.Aggregate.sum }],
                 category: { field: 'Product' },
                 color: { field: 'Product' }
             },
         }
     ],
     config: {
         plotAreas: [{
             legends: [{
                 type: GC.Spread.Sheets.DataCharts.LegendType.color,
                 position: GC.Spread.Sheets.DataCharts.LegendPosition.bottom,
                 padding: {
                     left: 30,
                 },
                 // Set the Horizontal Alignment
                 hAlign: GC.Spread.Sheets.DataCharts.HAlign.center   // Center Position (Default)
             }]
         }]
     }
 });

 const dataChart14 = sheet6.dataCharts.add('data-chart-14', 550, 10, 400, 250, GC.Spread.Sheets.DataCharts.DataChartType.column);
 dataChart14.setChartConfig({
     tableName: 'Sales',
     plots: [
         {
             type: GC.Spread.Sheets.DataCharts.DataChartType.column,
             encodings: {
                 values: [{ field: 'Sales', aggregate: GC.Spread.Sheets.DataCharts.Aggregate.sum }],
                 category: { field: 'Product' },
                 color: { field: 'Product' }
             },
         }
     ],
     config: {
         plotAreas: [{
             legends: [{
                 type: GC.Spread.Sheets.DataCharts.LegendType.color,
                 position: GC.Spread.Sheets.DataCharts.LegendPosition.bottom,
                 padding: {
                     left: 30,
                 },
                 // Set the Horizontal Alignment
                 hAlign: GC.Spread.Sheets.DataCharts.HAlign.right   // Right Position
             }]
         }]
     }
 });

 // 7. vAlign
 let sheet7 = spread.getSheet(6);
 sheet7.name("vAlign");
 sheet7.setValue(13, 0, "Vertical Alignment: Top");
 sheet7.setValue(30, 0, "Vertical Alignment: Center  (Default Value)");
 sheet7.setValue(13, 9, "Vertical Alignment: Bottom");

 const dataChart15 = sheet7.dataCharts.add('data-chart-15', 10, 10, 400, 250, GC.Spread.Sheets.DataCharts.DataChartType.column);
 dataChart15.setChartConfig({
     tableName: 'Sales',
     plots: [
         {
             type: GC.Spread.Sheets.DataCharts.DataChartType.column,
             encodings: {
                 values: [{ field: 'Sales', aggregate: GC.Spread.Sheets.DataCharts.Aggregate.sum }],
                 category: { field: 'Product' },
                 color: { field: 'Product' }
             },
         }
     ],
     config: {
         plotAreas: [{
             legends: [{
                 type: GC.Spread.Sheets.DataCharts.LegendType.color,
                 position: GC.Spread.Sheets.DataCharts.LegendPosition.right,
                 padding: {
                     left: 30,
                 },
                 // Set the Vertical Alignment
                 vAlign: GC.Spread.Sheets.DataCharts.VAlign.top   // Top Position
             }]
         }]
     }
 });

 const dataChart16 = sheet7.dataCharts.add('data-chart-16', 10, 350, 400, 250, GC.Spread.Sheets.DataCharts.DataChartType.column);
 dataChart16.setChartConfig({
     tableName: 'Sales',
     plots: [
         {
             type: GC.Spread.Sheets.DataCharts.DataChartType.column,
             encodings: {
                 values: [{ field: 'Sales', aggregate: GC.Spread.Sheets.DataCharts.Aggregate.sum }],
                 category: { field: 'Product' },
                 color: { field: 'Product' }
             },
         }
     ],
     config: {
         plotAreas: [{
             legends: [{
                 type: GC.Spread.Sheets.DataCharts.LegendType.color,
                 position: GC.Spread.Sheets.DataCharts.LegendPosition.right,
                 padding: {
                     left: 30,
                 },
                 // Set the Vertical Alignment
                 vAlign: GC.Spread.Sheets.DataCharts.VAlign.middle   // Middle Position (Default Value)
             }]
         }]
     }
 });

 const dataChart17 = sheet7.dataCharts.add('data-chart-17', 550, 10, 400, 250, GC.Spread.Sheets.DataCharts.DataChartType.column);
 dataChart17.setChartConfig({
     tableName: 'Sales',
     plots: [
         {
             type: GC.Spread.Sheets.DataCharts.DataChartType.column,
             encodings: {
                 values: [{ field: 'Sales', aggregate: GC.Spread.Sheets.DataCharts.Aggregate.sum }],
                 category: { field: 'Product' },
                 color: { field: 'Product' }
             },
         }
     ],
     config: {
         plotAreas: [{
             legends: [{
                 type: GC.Spread.Sheets.DataCharts.LegendType.color,
                 position: GC.Spread.Sheets.DataCharts.LegendPosition.right,
                 padding: {
                     left: 30,
                 },
                 // Set the Vertical Alignment
                 vAlign: GC.Spread.Sheets.DataCharts.VAlign.bottom   // Bottom Position
             }]
         }]
     }
 });

 // 8. Padding
 let sheet8 = spread.getSheet(7);
 sheet8.name("Padding");
 sheet8.setValue(13, 0, "Left Padding: 30");

 const dataChart18 = sheet8.dataCharts.add('data-chart-18', 10, 10, 400, 250, GC.Spread.Sheets.DataCharts.DataChartType.column);
 dataChart18.setChartConfig({
     tableName: 'Sales',
     plots: [
         {
             type: GC.Spread.Sheets.DataCharts.DataChartType.column,
             encodings: {
                 values: [{ field: 'Sales', aggregate: GC.Spread.Sheets.DataCharts.Aggregate.sum }],
                 category: { field: 'Product' },
                 color: { field: 'Product' }
             },
         }
     ],
     config: {
         plotAreas: [{
             legends: [{
                 type: GC.Spread.Sheets.DataCharts.LegendType.color,
                 position: GC.Spread.Sheets.DataCharts.LegendPosition.right,
                 padding: {
                     left: 30,
                 }
             }]
         }]
     }
 });


