- SpreadJS Overview
- Getting Started
- JavaScript Frameworks
- Best Practices
-
Features
- Workbook
- Worksheet
- Rows and Columns
- Headers
- Cells
- Data Binding
- Data Manager
- TableSheet
- GanttSheet
- ReportSheet
- Data Charts
- JSON Schema with SpreadJS
- SpreadJS File Format
- Data Validation
- Conditional Formatting
- Sort
- Group
- Formulas
- What-If Analysis
- Serialization
- Keyboard Actions
- Shapes
- Floating Objects
- Barcodes
-
Charts
- Chart Elements
- Chart Types
- Add Trendlines To Charts
- Add Error Bars In Charts
- Animation in Charts
- Add Hover Animation and Style
- Apply and Customize Color Schemes
- Add Chart Color with Transparency
- Add Charts with Multi-selections
- Add Charts using Table Structure Reference
- Display Empty Cells in Chart
- Display N/A Cells in Chart
- Add Source Linked Cell Formatter
- Hidden Rows or Columns in Chart
- Preserve Unsupported Charts
- Pattern Fill in Charts
- Add Shape-Based Charts
- Export Charts as Image
- Sparklines
- Tables
- Pivot Table
- Slicer
- Theme
- User Management
- Culture
- AI Assistant
- SpreadJS Designer
- SpreadJS Designer VSCode Plugin
- Tutorials
- SpreadJS Designer Component
- SpreadJS Collaboration Server
- Touch Support
- Formula Reference
- Import and Export Reference
- Events
- API Documentation
- Release Notes
Edit Series
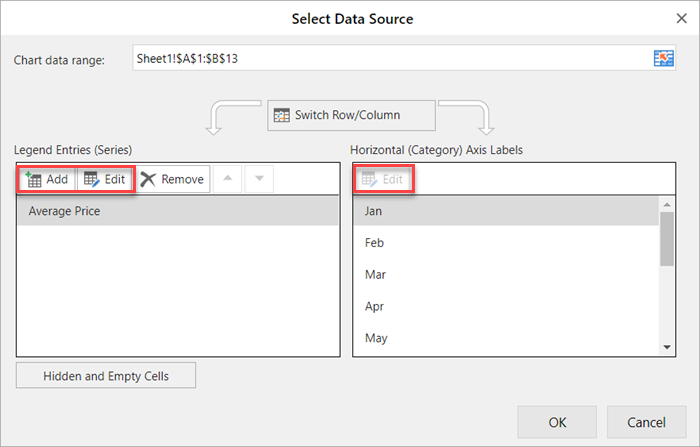
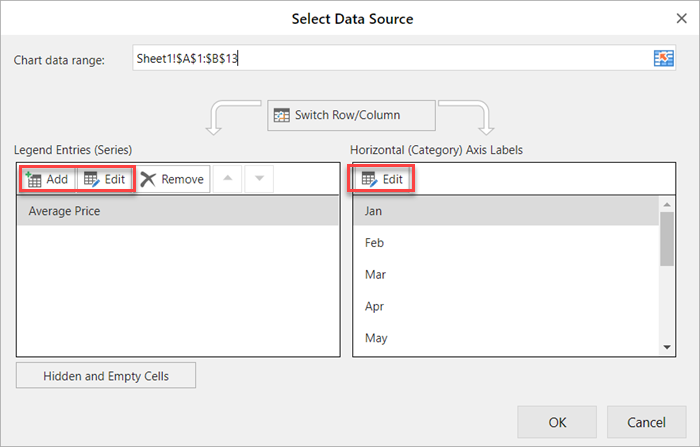
You can manage the data series plotted on your charts using a comprehensive set of options to help you customize the appearance and behavior of the data series within your chart through the Select Data Source dialog.
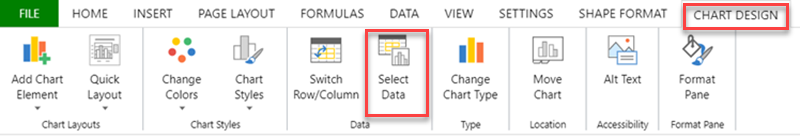
To open the Select Data Source dialog, click CHART DESIGN > Select Data ribbon button in the Data group.
The Select Data Source dialog allows you to set the name and XY values for each series. For the name and the Y values, use the Add/Edit button of the Series option, whereas the Edit button of the Category Axis Labels option is used for the X values.
However, for Scatter and Bubble charts, you may edit the name, X values, and Y values using the Series option only, since the Edit button from Category Axis Labels option is disabled.