- SpreadJS Overview
- Getting Started
- JavaScript Frameworks
- Best Practices
-
Features
- Workbook
- Worksheet
- Rows and Columns
- Headers
- Cells
- Data Binding
- TableSheet
- GanttSheet
- ReportSheet
- Data Charts
- JSON Schema with SpreadJS
- SpreadJS File Format
- Data Validation
- Conditional Formatting
- Sort
- Group
- Formulas
- Serialization
- Keyboard Actions
- Shapes
- Floating Objects
- Barcodes
-
Charts
- Chart Elements
- Chart Types
- Add Trendlines To Charts
- Add Error Bars In Charts
- Animation in Charts
- Add Hover Animation and Style
- Apply and Customize Color Schemes
- Add Chart Color with Transparency
- Add Charts with Multi-selections
- Add Charts using Table Structure Reference
- Display Empty Cells in Chart
- Display N/A Cells in Chart
- Add Source Linked Cell Formatter
- Hidden Rows or Columns in Chart
- Preserve Unsupported Charts
- Pattern Fill in Charts
- Add Shape-Based Charts
- Export Charts as Image
- Sparklines
- Tables
- Pivot Table
- Slicer
- Theme
- User Management
- Culture
- AI Assistant
- SpreadJS Designer
- Tutorials
- SpreadJS Designer Component
- SpreadJS Collaboration Server
- Touch Support
- Formula Reference
- Import and Export Reference
- Frequently Used Events
- API Documentation
- Release Notes
Axes
SpreadJS allows users to configure and customize axes in a chart along with the display units.
What are Axes?
Axes refer to the dimensions of the plot area in terms of a horizontal scale (x-axis or category axis) and a vertical scale (y-axis or value axis).
Types of Chart Axes: Typically, a basic two-dimensional chart contains four types of axes, namely the primary category axis, the primary value axis, the secondary category axis, and the secondary value axis.
Configure Display Units On Value Axis
Display units can be configured only on the value axis (both primary value axis and secondary value axis). There are two ways to configure axes display units while working with charts in SpreadJS:
Users can choose from a predefined list of available options (None, Hundreds, Thousands, 10000, 100000, Millions, 100000000000, 10000000000, Billions, Trillions, etc.) while showing the displaying unit values.
Users can define a custom display unit with a meaningful numeric value that is not available in the built-in options. However, it is important to note that the custom display unit value provided by the user must be a positive number. Also, while defining custom axis display units, custom text values i.e. strings are not supported.
The following screenshot depicts a chart with a built-in configuration of the display unit on the primary value axis and the custom configuration of the display unit on the secondary value axis.
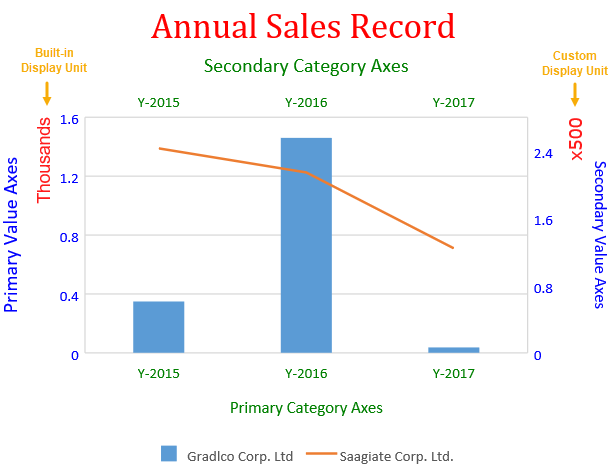
Users can get or set the axes of the chart using the method of the class. While working with charts, users can add, modify and customize the axes display units as per their specific requirements and preferences. If users want to delete the axis display units from the chart, then the value of the axis display unit must be set to null.
Supported Chart Types - Any chart type that contains a value axis supports the configuration of axis display units. Hence, only the primary value axis, and secondary value axis are supported.
Customize Display Unit Labels
While working with axis display units, users can choose whether to show or hide the display unit labels. Also, users can modify the default appearance of the display unit labels by changing their font, customizing the font color, and configuring the font family of the display units.
Note: The following limitations must be kept in mind while configuring and customizing the axis display units in a chart:
While performing JSON I/O, all properties of DisplayUnit are supported. However, while performing Excel I/O, if any style info for DisplayUnit is set, it is not saved to the XML of the Excel file. Hence the style of the display unit label is lost in the XML file.
This feature doesn't support the customization of the display unit label text.
The following code sample shows how to configure Axes along with display unit labels in the chart.
$(document).ready(function () {
    // Initializing Spread
    var spread = new GC.Spread.Sheets.Workbook(document.getElementById('ss'), { sheetCount: 1 });

    // Get the activesheet
    var activeSheet = spread.getActiveSheet();
    activeSheet.suspendPaint();
    // Prepare data for chart
    activeSheet.setValue(0, 1, "Y-2015");
    activeSheet.setValue(0, 2, "Y-2016");
    activeSheet.setValue(0, 3, "Y-2017");
    activeSheet.setValue(0, 4, "Y-2018");
    activeSheet.setValue(0, 5, "Y-2019");
    activeSheet.setValue(1, 0, "Gradlco Corp. Ltd");
    activeSheet.setValue(2, 0, "Saagiate Corp. Ltd.");
    activeSheet.setColumnWidth(0, 120);
    for (var r = 1; r <= 2; r++) {
        for (var c = 1; c <= 5; c++) {
            activeSheet.setValue(r, c, parseInt(Math.random() * 5000));
        }
    }

    // Add columnClustered chart
    chart_columnClustered = activeSheet.charts.add('chart_columnClustered', GC.Spread.Sheets.Charts.ChartType.columnClustered, 50, 100, 500, 400);
    var series = chart_columnClustered.series();
    series.add({
        chartType: GC.Spread.Sheets.Charts.ChartType.columnClustered,
        axisGroup: GC.Spread.Sheets.Charts.AxisGroup.primary,
        name: "Sheet1!$A$2",
        xValues: "Sheet1!$B$1:$F$1",
        yValues: "Sheet1!$B$2:$D$2"
    });
    series.add({
        chartType: GC.Spread.Sheets.Charts.ChartType.line,
        axisGroup: GC.Spread.Sheets.Charts.AxisGroup.secondary,
        name: "Sheet1!$A$3",
        xValues: "Sheet1!$B$1:$F$1",
        yValues: "Sheet1!$B$3:$D$3"
    });
    var axes = chart_columnClustered.axes();

    // Configure Primary Category Axis
    axes.primaryCategory.style.color = 'green';
    axes.primaryCategory.title.color = 'green';
    axes.primaryCategory.title.text = 'Primary Category Axes';
    // Configure Primary Value Axis
    axes.primaryValue.style.color = 'blue';
    axes.primaryValue.title.color = 'blue';
    axes.primaryValue.title.text = 'Primary Value Axes';
    axes.primaryValue.title.fontSize = 16;
    // Configure BuiltIn DisplayUnit for "Primary Value Axis"
    axes.primaryValue.displayUnit = {
        unit: GC.Spread.Sheets.Charts.DisplayUnit.thousands, // BuiltIn DisplayUnit is thousands
        visible: true,
        style: {
            color: 'red',
            transparency: 0.1,
            fontFamily: 'arial',
            fontSize: 14
        }
    };
    // Configure Secondary Category Axis
    axes.secondaryCategory.visible = true;
    axes.secondaryCategory.style.color = 'green';
    axes.secondaryCategory.title.color = 'green';
    axes.secondaryCategory.title.text = 'Secondary Category Axes';
    axes.secondaryCategory.title.fontSize = 16;
    // Configure Custom DisplayUnit for "Secondary Value Axis"
    axes.secondaryValue.displayUnit = {
        unit: 500, // Custom Display unit is 500
        visible: true,
        style: {
            color: 'red',
            transparency: 0.1,
            fontFamily: 'Verdana',
            fontSize: 14
        }
    };
    // Configure Secondary Value Axis
    axes.secondaryValue.style.color = 'blue';
    axes.secondaryValue.title.color = 'blue';
    axes.secondaryValue.format = 'General';
    axes.secondaryValue.title.text = 'Secondary Value Axes';
    chart_columnClustered.axes(axes);
    // Configure Chart Title
    var title = chart_columnClustered.title();
    title.text = "Annual Sales Record";
    title.fontFamily = "Cambria";
    title.fontSize = 28;
    title.color = "Red";
    chart_columnClustered.title(title);
    activeSheet.resumePaint();
});
Configure Dates on Category Axis
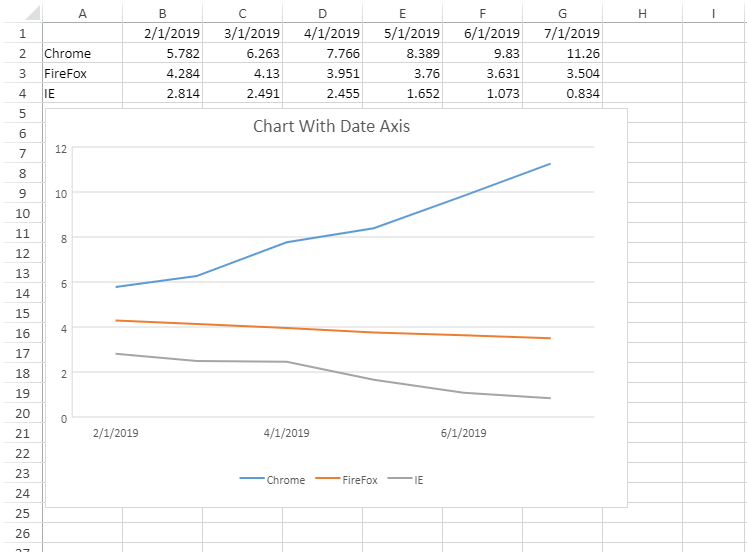
SpreadJS allows users to configure dates on the category axis by configuring it as a date (time-scale) axis. The data of days, months, or years can be plotted on the category axis using various properties, like:
BaseUnit: Represents base unit values like Days, Months, or Years.
MajorUnit: Represents interval number value between two major tick marks.
MajorUnitScale: Represents major unit scale value (Days, Months, or Years) for the category axis.
MinorUnit: Represents interval number value between two minor tick marks.
MinorUnitScale: Represents minor unit scale value (Days, Months, or Years) for the category axis.
The difference in the intervals of the base unit is the smallest difference between the units which can be accommodated by the size of the chart. However, this difference can be customized by specifying the value of the interval number between two tick marks by using the MajorUnit and MinorUnit properties.
The following screenshot depicts a chart showing the average viewing time of a webpage on three different browsers in different months. The category axis has been configured as a date axis with months as its base unit and 2 as the interval number value between two major tick marks.
// Initializing Spread
var spread = new GC.Spread.Sheets.Workbook(document.getElementById('ss'), { sheetCount: 1 });
// Get the activesheet
var activeSheet = spread.getActiveSheet();
// Create array
var dataArray = [
    ["", new Date(2019, 1, 1), new Date(2019, 2, 1), new Date(2019, 3, 1), new Date(2019, 4, 1), new Date(2019, 5, 1), new Date(2019, 6, 1)],
    ["Chrome", 5.782, 6.263, 7.766, 8.389, 9.830, 11.260],
    ["FireFox", 4.284, 4.130, 3.951, 3.760, 3.631, 3.504],
    ["IE", 2.814, 2.491, 2.455, 1.652, 1.073, 0.834],
];
// Set columns width
for (var i = 0; i < 8; i++) {
    activeSheet.setColumnWidth(i, 80.0, GC.Spread.Sheets.SheetArea.viewport);
}
// Set array
activeSheet.setArray(0, 0, dataArray);
// Set date formatter for a range
activeSheet.getRange(0, 0, 1, 7).formatter("m/d/yyyy");
// Add chart
var chart = activeSheet.charts.add('ChartWithDateAxis', GC.Spread.Sheets.Charts.ChartType.line, 2, 85, 400, 400, 'A1:G4');
// Set chart title
chart.title({ text: "Chart With Date Axis" });
// Set chart axes properties
var axes = chart.axes();

// Setting primaryCategory i.e. DateAxis properties
axes.primaryCategory.baseUnit = GC.Spread.Sheets.Charts.TimeUnit.months;
axes.primaryCategory.majorUnit = 1;
// axes.primaryCategory.minorUnit = 1;
axes.primaryCategory.majorUnitScale = GC.Spread.Sheets.Charts.TimeUnit.months;
// axes.primaryCategory.minorUnitScale = GC.Spread.Sheets.Charts.TimeUnit.days;
chart.axes(axes);
Note: Hours, minutes, and seconds are not supported by the date axis.
If the value of minorUnitScale is more than majorUnitScale, it will not work for minorUnitScale.
Set Crossed Axis
You can customize the horizontal axis cross value to change the appearance of the charts, just like in Excel. The crossed axis in a chart is useful to represent data in cases where data points fall between both positive and negative values. To support this, the AxisCrossPoint enumeration provides the following three options.
automatic - Allows the user to set the axis crossing point
maximum - Allows the user to set the axis crosses at the maximum value
minimum - Allows the user to set the axis crosses at a minimum value
You can adjust the cross position by using the crossPoint property of primaryCategory and primaryValue class.
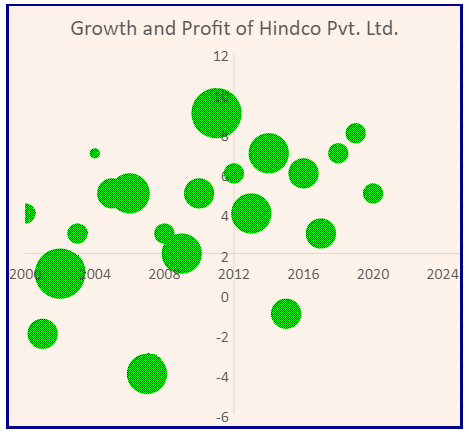
Let's see how we can set the crossed axis of a chart. For example in the following use case, let's say a user wants to evaluate the profit amount before and after 2012 wherein growth exceeds or falls behind 2 percent. To represent the growth and profit of the company, we are using a bubble chart where each bubble represents the growth and profit incurred in a particular year. The data labels which we see while hovering on the bubbles will display the growth percent and Profit amount in a particular year.
To analyze the profit amount in which the growth exceeds or falls behind 2 percent, the crossPoint value for primaryCategory (Y-axis) is set to 2012, and the crossPoint for primaryValue (or X-axis) is set to 2. With this crossPoint positioning, the user can easily segregate and comprehend the 'growth' and 'profit amount' data in all the four quadrants of the chart. Using the left upper and lower quadrants of the chart, the user can analyze the profit amount in the years before 2012, where the growth exceeds or falls short of 2 percent. Similarly, using the right upper and lower quadrants of the chart, the user can evaluate the profit amount in the years after 2012, where the growth exceeds or falls behind the value of 2 percent.
The following code sample shows how to configure crossed axis in charts.
$(document).ready(function () {
    // initializing Spread
    var spread = new GC.Spread.Sheets.Workbook(document.getElementById('ss'), { sheetCount: 1 });
    // get the sheet
    var sheet = spread.getSheet(0);
    sheet.suspendPaint();
    // set column width
    sheet.setColumnWidth(0, 80);
    sheet.setColumnWidth(1, 90);
    sheet.setColumnWidth(2, 110);
    // create data array
    var dataArray = [
        ["Year", "Growth (%)", "Profit Amount ($)"],
        [2000, 4, 3123123],
        [2001, -2, 4123123],
        [2002, 1, 8456456],
        [2003, 3, 2345435],
        [2004, 7, 1768678],
        [2005, 5, 5453456],
        [2006, 5, 6676878],
        [2007, -4, 7434234],
        [2008, 3, 3834234],
        [2009, 2, 6756756],
        [2010, 5, 5672123],
        [2011, 9, 9743546],
        [2012, 6, 3464513],
        [2013, 4, 7431545],
        [2014, 7, 7456456],
        [2015, -1, 4567687],
        [2016, 6, 4870231],
        [2017, 3, 4353453],
        [2018, 7, 3459021],
        [2019, 8, 2390123],
        [2020, 5, 2302303],
    ];
    // set data array
    sheet.setArray(0, 0, dataArray);
    // add chart
    var chart = sheet.charts.add('BubbleChart1', GC.Spread.Sheets.Charts.ChartType.bubble, 320, 30, 620, 400, "A2:C22");
    // hide gridlines from the chart
    var gridLinesAxes = chart.axes();
    gridLinesAxes.primaryCategory.majorGridLine.visible = false;
    gridLinesAxes.primaryValue.majorGridLine.visible = false;
    chart.axes(gridLinesAxes);
    // get the series and set its backcolor with a pattern
    var series = chart.series().get();
    var seriesItem = series[0];
    seriesItem.backColor = {
        type: GC.Spread.Sheets.Charts.PatternType.dottedPercent40,
        foregroundColor: "blue",
        backgroundColor: "lime",
    }
    chart.series().set(0, seriesItem);
    // Configure ChartArea
    var chartArea = chart.chartArea();
    chartArea.backColor = "#FDF2E9";
    chartArea.fontSize = 16;
    // Set ChartArea's Border Style
    chartArea.border.width = 3;
    chartArea.border.color = "darkblue";
    chart.chartArea(chartArea);
    // set title for chart
    var title = chart.title();
    title.fontSize = "22.00";
    title.text = "Growth and Profit of Hindco Pvt. Ltd.";
    chart.title(title);
    // hide legend of the chart
    var legend = chart.legend();
    legend.visible = false;
    chart.legend(legend);
    // set crossPoint for x & y axis
    var axes = chart.axes();
    axes.primaryCategory.crossPoint = 2012; // y axis
    axes.primaryValue.crossPoint = 2; // x axis
    chart.axes(axes);
    // set the style for cells
    var style = new GC.Spread.Sheets.Style();
    style.font = "bold 12px Arial";
    style.foreColor = "white";
    style.backColor = "#5B9BD5";
    style.hAlign = GC.Spread.Sheets.HorizontalAlign.center;
    style.vAlign = GC.Spread.Sheets.VerticalAlign.center;
    for (var i = 0; i < 3; i++)
        sheet.setStyle(0, i, style, GC.Spread.Sheets.SheetArea.viewport);
    sheet.resumePaint();
});Note: The cross-axis feature is temporarily not supported for the date axis.
Set Axis Orientation
You can control the orientation of chart axes and choose to display it in the reverse order as well. The below image depicts the default and the reverse orientation of the primary value axis.
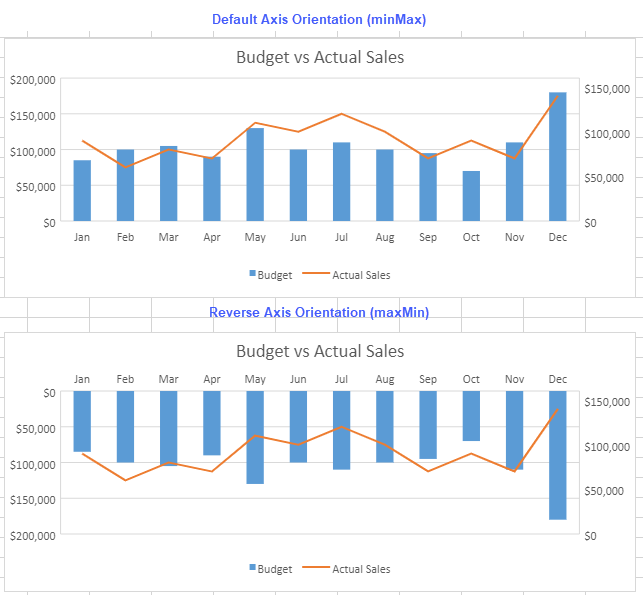
The orientation property can be set to 0 (for default order) or 1 (for reverse order). Alternatively, it can also be set to minMax (default) or maxMin (reverse) values of AxisOrientation enumeration.
The following code sample shows how to set the default and reverse axis orientation in a chart.
var axesMin = minMaxChart.axes();
axesMin.primaryValue.scaling = {
    orientation: GC.Spread.Sheets.Charts.AxisOrientation.minMax
    // or
    //orientation: 0
};
minMaxChart.axes(axesMin);

var axesMax = maxMinChart.axes();
axesMax.primaryValue.scaling = {
    orientation: GC.Spread.Sheets.Charts.AxisOrientation.maxMin
    // or
    //orientation: 1
};
maxMinChart.axes(axesMax);Limitation: The axis orientation cannot be set for pie, sunburst, treemap, and funnel charts.
Set Axis Label Position
You can set the position of axis data labels in a chart by using the tickLabelPosition property. The data labels can be placed in the following positions by using TickLabelPosition enumeration:
High or 0: Top or right side of the chart
Low or 1: Bottom or left side of the chart
Next to Axis or 2: Next to an axis (where the axis is not at either side of the chart) (Default Value)
None or 3: No tick labels
The image below depicts the default and high label position of data labels for the primary category axis.
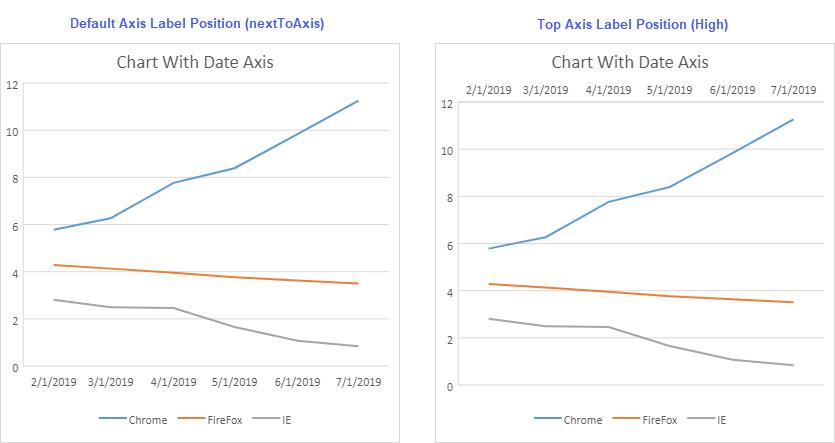
The following code sample sets the default and top axis data label positions in a chart.
// set chart axes properties
var axesTickDefault = chart.axes();
// set tickLabelPosition to default nextToAxis
axesTickDefault.primaryCategory.tickLabelPosition = GC.Spread.Sheets.Charts.TickLabelPosition.nextToAxis;
// or
// axesTickDefault.primaryCategory.tickLabelPosition = 2;
chart.axes(axesTickDefault);

var axesTickHigh = chart.axes();
// set tickLabelPosition to High
axesTickHigh.primaryCategory.tickLabelPosition = GC.Spread.Sheets.Charts.TickLabelPosition.high;
// or
// axesTickDefault.primaryCategory.tickLabelPosition = 0;
chart.axes(axesTickHigh);
Set Axis Label Angle
The labelAngle property controls the rotation angle of axis data labels in a chart. This numeric property accepts values within the range of -90 to 90 degrees, with the following specifications:
Default value:
undefined(no rotation)Maximum value:
90(90-degree clockwise rotation)Minimum value:
-90(90-degree counterclockwise rotation)
The image below depicts the default and 45-degree angle of the data labels for the primary category axis.
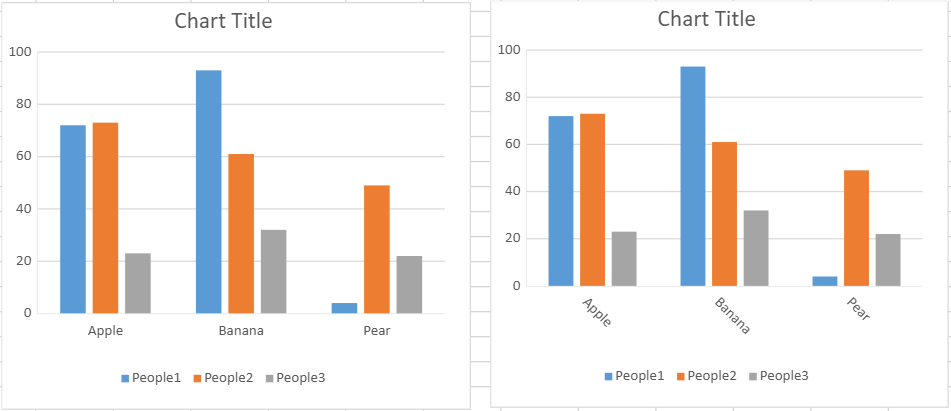
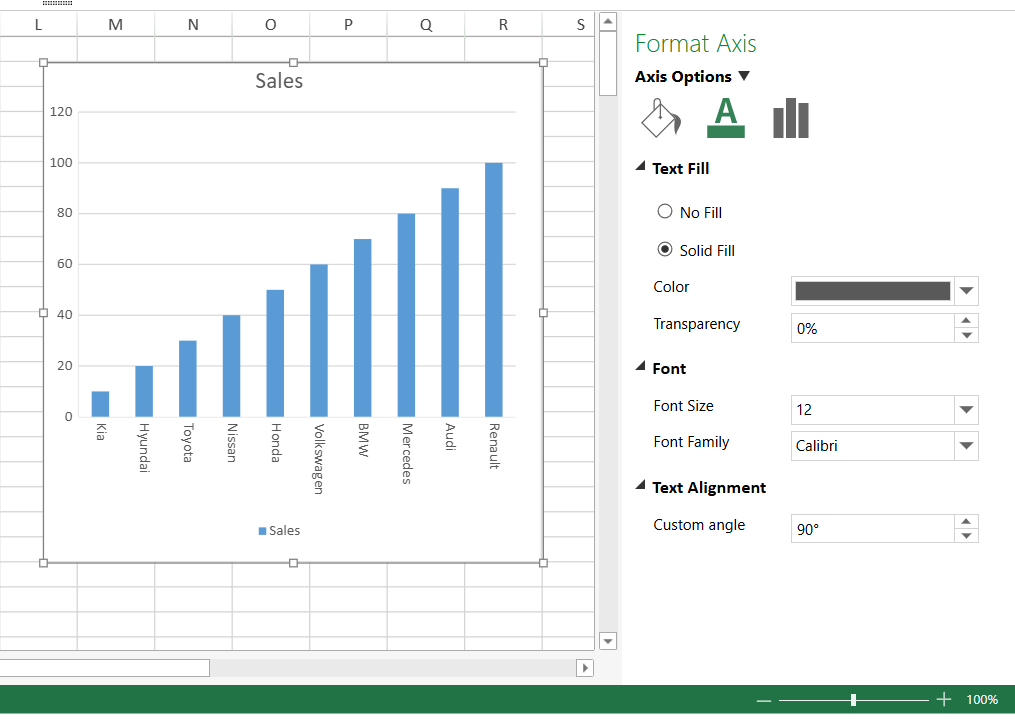
The following code sample sets the 90-degree custom angle of the data labels in a chart.
var dataArray = [
    ['Manufacturer', 'Kia', 'Hyundai', 'Toyota', 'Nissan', 'Honda', 'Volkswagen', 'BMW', 'Mercedes', 'Audi', 'Renault'],
    ['Sales', 10, 20, 30, 40, 50, 60, 70, 80, 90, 100],
];
sheet.setArray(0, 0, dataArray);
var chart = sheet.charts.add('chart1', GC.Spread.Sheets.Charts.ChartType.columnClustered, 450, 100, 400, 400, "A1:K2");
var axesTemp = chart.axes();
axesTemp.primaryCategory.labelAngle = 90;
chart.axes(axesTemp);
Set Axis Label Angle in the Designer
Set Axis Label Intervals
The interval unit between labels on the chart axis controls the spacing between consecutive labels. This feature enables you to adjust the density of the labels and ensures that they are properly spaced to avoid overcrowding and overlapping for a clear representation of data.
You can set the interval unit to default or custom values similar to Excel's functionality. Using the tickLabelSpacing property of the GC.Spread.Sheets.Charts.IAxis interface, you can create a custom interval unit for axis labels. The default value of the tickLabelSpacing property is 1, which displays all the labels in the chart.
The image below depicts the default labels and labels with spacing for the primary category axis.
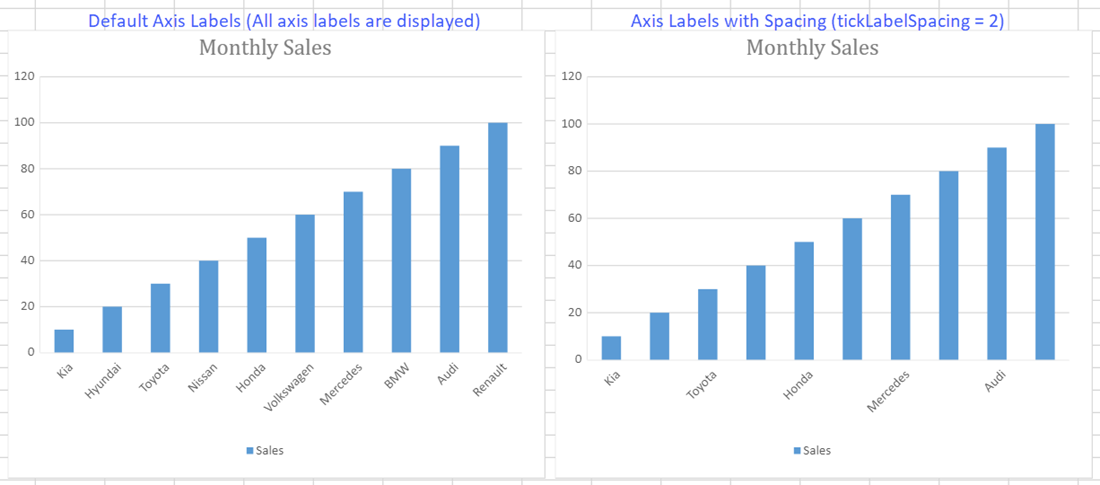
The following code sample sets the interval between the primary category axis labels in a chart.
// Set interval between axis labels.
var dataArray = [
['Manufacturer', 'Kia', 'Hyundai', 'Toyota', 'Nissan', 'Honda', 'Volkswagen', 'BMW', 'Mercedes', 'Audi', 'Renault'],
['Sales', 10, 20, 30, 40, 50, 60, 70, 80, 90, 100],
];
sheet.setArray(0, 0, dataArray);
var chart = sheet.charts.add('chart1', GC.Spread.Sheets.Charts.ChartType.columnClustered, 450, 100, 400, 400, "A1:K2");
let axesTemp = chart.axes();
axesTemp.primaryCategory.tickLabelSpacing = 2;
chart.axes(axesTemp);
Additionally, for charts with multi-level axis labels, the tickLabelSpacing property is applied to leaf nodes bound to the category field in the last level. Leaf nodes refer to the last node in the tree structure.
The display of parent-level axis labels depends on the state of the first axis label in the child labels:
If the first axis label is displayed, its parent axis label is also displayed.
If the first axis label is hidden, its parent axis label is hidden as well.
The image below depicts the default labels and labels with spacing for the multi-level axis labels.
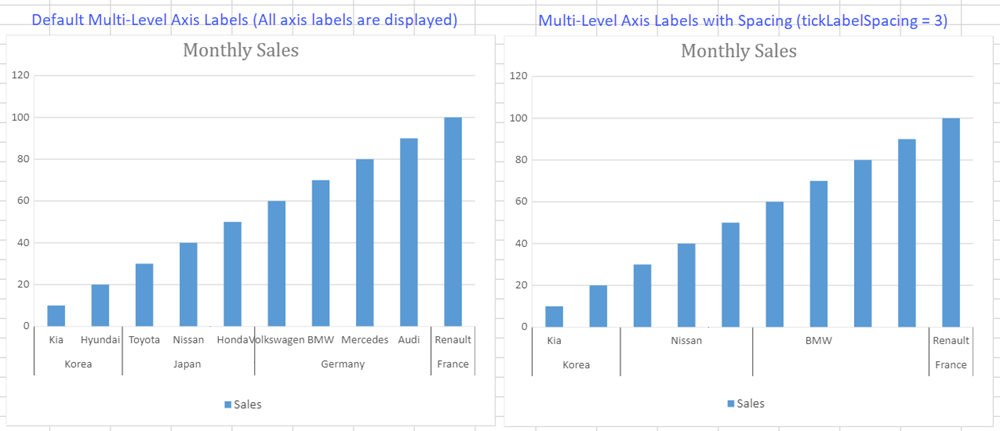
The following code sample sets the interval between the multi-level axis labels in a chart.
// Set interval between multi level axis labels.
var dataArray = [
['Country', 'Korea', 'Japan', 'Germany', 'France'],
['Manufacturer', 'Kia', 'Hyundai', 'Toyota', 'Nissan', 'Honda', 'Volkswagen', 'BMW', 'Mercedes', 'Audi', 'Renault'],
['Sales', 10, 20, 30, 40, 50, 60, 70, 80, 90, 100],
];
sheet.setArray(0, 0, dataArray);
var chart = sheet.charts.add('chart1', GC.Spread.Sheets.Charts.ChartType.columnClustered, 150, 100, 400, 400, "B1:K3");
let axesTemp = chart.axes();
axesTemp.primaryCategory.tickLabelSpacing = 3;
chart.axes(axesTemp);
Limitations
Setting
tickLabelSpacingproperty for a chart containing a date or number axis is not supported.The
tickLabelSpacingproperty is not supported in Sunburst, Treemap, Waterfall, Funnel, and Radar charts.When the
tickLabelSpacingproperty is undefined and the chart is resized to a smaller size, Excel automatically adjusts the label spacing.However, SpreadJS does not currently use this policy.


