
- SpreadJS Overview
- Getting Started
- JavaScript Frameworks
- Best Practices
-
Features
- Workbook
- Worksheet
- Rows and Columns
- Headers
- Cells
- Data Binding
- Data Manager
- TableSheet
- GanttSheet
- ReportSheet
- Data Charts
- JSON Schema with SpreadJS
- SpreadJS File Format
- Data Validation
- Conditional Formatting
- Sort
- Group
- Formulas
- What-If Analysis
- Serialization
- Keyboard Actions
- Shapes
- Floating Objects
- Barcodes
-
Charts
- Chart Elements
- Chart Types
- Add Trendlines To Charts
- Add Error Bars In Charts
- Animation in Charts
- Add Hover Animation and Style
- Apply and Customize Color Schemes
- Add Chart Color with Transparency
- Add Charts with Multi-selections
- Add Charts using Table Structure Reference
- Display Empty Cells in Chart
- Display N/A Cells in Chart
- Add Source Linked Cell Formatter
- Hidden Rows or Columns in Chart
- Preserve Unsupported Charts
- Pattern Fill in Charts
- Add Shape-Based Charts
- Export Charts as Image
- Sparklines
- Tables
- Pivot Table
- Slicer
- Theme
- User Management
- Culture
- AI Assistant
- SpreadJS Designer
- SpreadJS Designer VSCode Plugin
- Tutorials
- SpreadJS Designer Component
- SpreadJS Collaboration Server
- Touch Support
- Formula Reference
- Import and Export Reference
- Events
- API Documentation
- Release Notes
Export Charts as Image
You can export charts as image sources in SpreadJS. After inserting the chart in the sheet, you can get the image source using the chart.toImageSrc() API.
Using Code
The following code sample depicts how to save the shape object on spreadsheet as an image source.
// Add a column chart.
// Prepare chart data.
   sheet.setArray(0, 0, [
        ["", "Chrome", "FireFox", "IE", "Safari"],
        ["2020", 51, 34, 11, 27],
        ["2021", 23, 31, 73, 64],
        ["2022", 36, 24, 83, 89]
   ]);

// Add a chart.
let chart = sheet.charts.add('Chart1', GC.Spread.Sheets.Charts.ChartType.columnClustered, 100, 100, 500, 280, "A1:E4");

// Get the chart as an image source.
let chartImageSrc = sheet.charts.all()[0].toImageSrc();
Using Designer
When you select a chart in Spread Designer, you can also save it as an image by clicking the Save as Picture option.
Following are the steps to save a chart as an image:
Open a worksheet.
Insert data as per your requirement.
Insert a chart.
Right-click on the chart and then click Save as Picture.
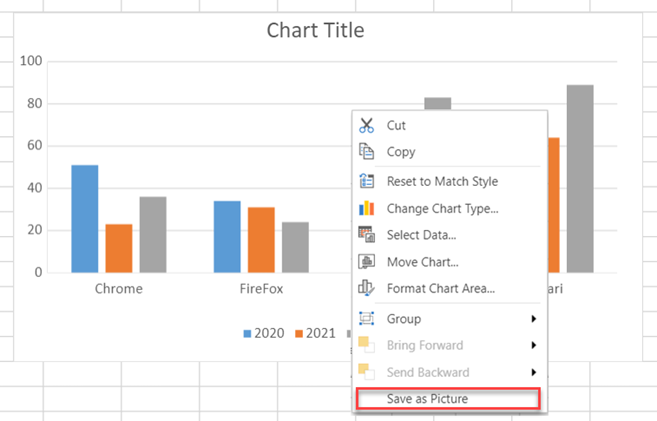
Select the location where you would like to save the image.
Name the file and click Save.
Note:
Currently, the exported file format is PNG and the file name is the default object name. For example, Chart 1.
If multiple chart objects are selected, they will be exported together and all of them will be exported as a file named SpreadShapes by default.