
- Document Solutions for Excel Java Overview
- Key Features
- Getting Started
- Features
- Templates
- Formula Reference
- File Operations
-
Tutorials
- Saving and Export Excel XLSX Files Using Java
- Creating and Formatting Excel Tables Using Java
- Creating Pivot Tables in Excel Using Java
- Adding Charts to Excel Files Programmatically in Java
- Use Excel Formulas and Named Ranges Programmatically in Java
- Apply Excel Styles, Formatting, and Conditional Formatting in Java
- Use JDK 8 Date Time API
- Document Solutions Data Viewer
- API Reference
- Release Notes
Apply Excel Styles, Formatting, and Conditional Formatting in Java
Apply Excel Styles, Formatting, and Conditional Formatting in Java (DsExcel Java)
This tutorial shows how to control Excel formatting and visual presentation programmatically using Document Solutions for Excel, Java Edition (DsExcel Java). You’ll learn how to create reusable styles, apply number formats, add borders and fills, and use conditional formatting (like data bars) for clean, report-ready output.
Prerequisites
JDK 8+
DsExcel Java (JARs added to your classpath)
import com.grapecity.documents.excel.*;1) Create a Workbook + Add Sample Data
First we start by creating a new workbook and worksheet, and then adding in some sample data.
Workbook workbook = new Workbook();
IWorksheet worksheet = workbook.getWorksheets().get(0);
worksheet.setName("Formatting");
Add a simple dataset (income + expenses) and formulaic logic that we will use later to calculate the difference:
Object[][] incomeData = new Object[][] {
    {"ITEM", "AMOUNT"},
    {"Income 1", 2500},
    {"Income 2", 1000},
    {"Income 3", 250},
    {"Other", 250},
};

Object[][] expenseData = new Object[][] {
    {"ITEM", "AMOUNT"},
    {"Rent/mortgage", 800},
    {"Electricity", 120},
    {"Gas", 50},
    {"Cell phone", 45},
    {"Groceries", 500},
    {"Car payment", 273},
};

// Set Income and Expense tables up with proper labels
worksheet.getRange("B2").setValue("Income");
worksheet.getRange("B9").setValue("Expenses");
worksheet.getRange("B3:C7").setValue(incomeData);
worksheet.getRange("B10:C16").setValue(expenseData);
// Add up totals and merge cells for later use
worksheet.getRange("B8").setValue("Total");
worksheet.getRange("C8").setFormula("SUM(C4, C5, C6, C7)");
worksheet.getRange("B17").setValue("Total");
worksheet.getRange("C17").setFormula("SUM(C11, C12, C13, C14, C15, C16)");
worksheet.getRange("F2").setValue("Income Spent");
worksheet.getRange("F2:H2").merge();
worksheet.getRange("F3:H3").merge();
2) Create and Reuse Styles (IStyle)
DsExcel lets you create (or modify) styles and reuse them across many ranges.
Currency style (number format + alignment)
IStyle currencyStyle = workbook.getStyles().get("Currency");
currencyStyle.setIncludeAlignment(true);
currencyStyle.setHorizontalAlignment(HorizontalAlignment.Left);
currencyStyle.setVerticalAlignment(VerticalAlignment.Bottom);
currencyStyle.setNumberFormat("$#,##0.00");
Heading style (font + fill color + alignment)
IStyle headingStyle = workbook.getStyles().get("Heading 1");
headingStyle.setIncludeAlignment(true);
headingStyle.setHorizontalAlignment(HorizontalAlignment.Center);
headingStyle.setVerticalAlignment(VerticalAlignment.Center);

headingStyle.setIncludeFont(true);
headingStyle.getFont().setName("Century Gothic");
headingStyle.getFont().setBold(true);
headingStyle.getFont().setSize(11);
headingStyle.getFont().setColor(Color.GetWhite());

headingStyle.setIncludePatterns(true);
headingStyle.getInterior().setColor(Color.FromArgb(255, 32, 61, 64));
Percentage style (large, bold percent display)
IStyle percentStyle = workbook.getStyles().get("Percent");
percentStyle.setIncludeAlignment(true);
percentStyle.setHorizontalAlignment(HorizontalAlignment.Center);

percentStyle.setIncludeFont(true);
percentStyle.getFont().setName("Century Gothic");
percentStyle.getFont().setBold(true);
percentStyle.getFont().setSize(14);
percentStyle.getFont().setColor(Color.FromArgb(255, 32, 61, 64));
3) Apply Number Formats: Currency and Percentage
Apply your styles to ranges that represent amounts or ratios.
// Currency cells (income + expense amounts)
worksheet.getRange("C4:C8, C11:C17").setStyle(currencyStyle);

// Header labels
worksheet.getRange("B3, B10, C3, C10").setStyle(headingStyle);
If you have a percentage cell, format it for readability. Here we are calculating the percentage of total income spent :
worksheet.getRange("F3").setFormula("C17/C8");     // total expenses divided by total income
worksheet.getRange("F3").setNumberFormat("0.00%"); // percent format
worksheet.getRange("F3").setStyle(percentStyle);
4) Borders and Background Fills
You can highlight important summary rows with borders and fills.
// Bottom border for a summary line
worksheet.getRange("A8:D8").getBorders().get(BordersIndex.EdgeBottom)
    .setLineStyle(BorderLineStyle.Medium);
worksheet.getRange("A8:D8").getBorders().get(BordersIndex.EdgeBottom)
    .setColor(Color.FromArgb(255, 32, 61, 64));

// Filled background row (e.g., balance row)
worksheet.getRange("B2, B9, F2").getInterior()
    .setColor(Color.FromArgb(255, 32, 61, 64));
worksheet.getRange("B2, B9, F2").getFont().setColor(Color.GetWhite());
worksheet.getRange("B2, B9, F2").getFont().setBold(true);
5) Conditional Formatting Example: Data Bars
Conditional formatting can make reports easier to scan. Here’s a simple data bar example.
IDataBar dataBar = worksheet.getRange("F3").getFormatConditions().addDatabar();
dataBar.getMinPoint().setType(ConditionValueTypes.Percent);
dataBar.getMinPoint().setValue(0);
dataBar.getMaxPoint().setType(ConditionValueTypes.Percent);
dataBar.getMaxPoint().setValue(100);

dataBar.setBarFillType(DataBarFillType.Gradient);
dataBar.getBarColor().setColor(Color.GetRed());
dataBar.setShowValue(true);
This produces an in-cell bar visualization when viewed in Excel.
6) Disable Gridlines for Clean Output
For report-style spreadsheets, turning off gridlines helps the formatting stand out.
worksheet.getSheetView().setDisplayGridlines(false);Save the Workbook
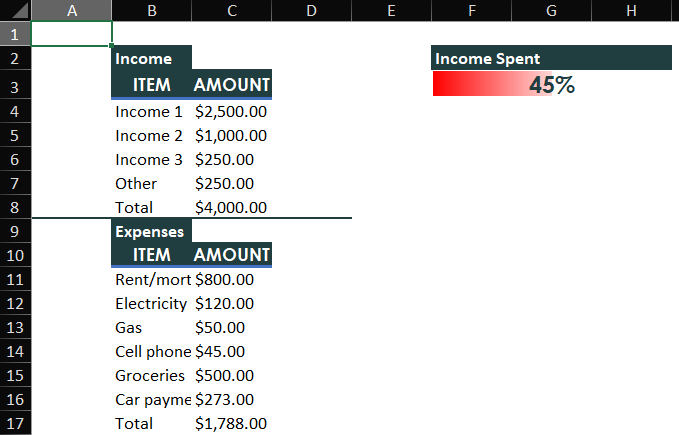
workbook.save("FormattingAndConditionalFormatting.xlsx");The final output will look like the below:
Next Steps
View more documentation on styling here
View more documentation on sparklines here
Explore our full-featured demos on formatting in Excel in Java
See our online demos covering sparklines in Excel in Java