


Create Excel Pivot Tables
This tutorial shows how to generate Excel Pivot Tables programmatically in a .NET applications using C# and an XLSX server-side API, Document Solutions for Excel .NET (DsExcel .NET). You’ll place your raw dataset on a dedicated source worksheet, then generate a pivot table on a separate report worksheet.
Pivot tables are one of the most useful Excel features for summarizing large datasets, such as sales reports, inventory lists, logs, or financial exports. With DsExcel .NET, you can automate pivot table creation directly in your .NET applications.
How Pivot Tables Work in DsExcel .NET
DsExcel .NET creates pivot tables in two steps:
Create a pivot cache using IPivotCaches.Create(...).
Insert a pivot table using IPivotTables.Add(...).
You can build the pivot cache from either:
A range.
A table.
Prerequisites
.NET SDK
Document Solutions for Excel .NET (DsExcel .NET)
The DS.Documents.Excel NuGet package installed in your project
Import the required namespace:
using GrapeCity.Documents.Excel;1) Add Pivot Source Data to a Separate Worksheet
Start by creating a workbook and a worksheet dedicated to pivot source data.
Workbook workbook = new Workbook();
IWorksheet sourceSheet = workbook.Worksheets[0];
sourceSheet.Name = "Pivot Source";
Add a dataset with a header row and records into a range. Pivot tables typically work best when your dataset is a clean rectangle with column headers.
object[,] sourceData = new object[,]
{
    { "Order ID", "Product", "Category", "Amount", "Date", "Country" },
    { 1, "Bose 785593-0050", "Consumer Electronics", 4270, new DateTime(2018, 1, 6), "United States" },
    { 2, "Canon EOS 1500D", "Consumer Electronics", 8239, new DateTime(2018, 1, 7), "United Kingdom" },
    { 3, "Haier 394L 4Star", "Consumer Electronics", 617, new DateTime(2018, 1, 8), "United States" },
    { 4, "IFB 6.5 Kg FullyAuto", "Consumer Electronics", 8384, new DateTime(2018, 1, 10), "Canada" },
    { 5, "Mi LED 40inch", "Consumer Electronics", 2626, new DateTime(2018, 1, 10), "Germany" },
    { 6, "Sennheiser HD 4.40-BT", "Consumer Electronics", 3610, new DateTime(2018, 1, 11), "United States" },
    { 7, "Iphone XR", "Mobile", 9062, new DateTime(2018, 1, 11), "Australia" },
    { 8, "OnePlus 7Pro", "Mobile", 6906, new DateTime(2018, 1, 16), "New Zealand" },
    { 9, "Redmi 7", "Mobile", 2417, new DateTime(2018, 1, 16), "France" },
    { 10, "Samsung S9", "Mobile", 7431, new DateTime(2018, 1, 16), "Canada" },
    { 11, "OnePlus 7Pro", "Mobile", 8250, new DateTime(2018, 1, 16), "Germany" },
    { 12, "Redmi 7", "Mobile", 7012, new DateTime(2018, 1, 18), "United States" },
    { 13, "Bose 785593-0050", "Consumer Electronics", 1903, new DateTime(2018, 1, 20), "Germany" },
    { 14, "Canon EOS 1500D", "Consumer Electronics", 2824, new DateTime(2018, 1, 22), "Canada" },
    { 15, "Haier 394L 4Star", "Consumer Electronics", 6946, new DateTime(2018, 1, 24), "France" },
};

sourceSheet.Range["A1:F16"].Value = sourceData;
sourceSheet.Range["A:F"].ColumnWidth = 18;
sourceSheet.Range["D2:D16"].NumberFormat = "$#,##0.00";
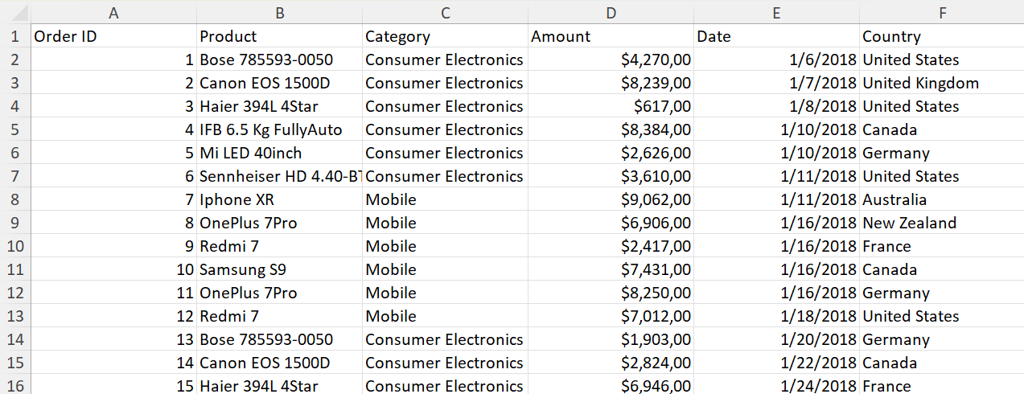
The Pivot Source sheet data will look as follows:
2) Create a Separate Worksheet for the Pivot Table Output
Create a second worksheet that will contain the pivot table.
IWorksheet pivotSheet = workbook.Worksheets.Add();
pivotSheet.Name = "Pivot Report";
3) Create the Pivot Cache
Build the pivot cache using the source range on the source worksheet.
IPivotCache pivotCache = workbook.PivotCaches.Create(sourceSheet.Range["A1:F16"]);4) Add the Pivot Table
Insert the pivot table onto the pivot report sheet, starting at a chosen cell, for example, A1.
IPivotTable pivotTable = pivotSheet.PivotTables.Add(
    pivotCache,
    pivotSheet.Range["A1"],
    "pivotTable1"
);
5) Configure Pivot Fields
Assign fields to their pivot roles:
RowField: items listed vertically.
ColumnField: grouped across the top.
DataField: summarized values such as Sum or Count.
PageField: filter dropdown.
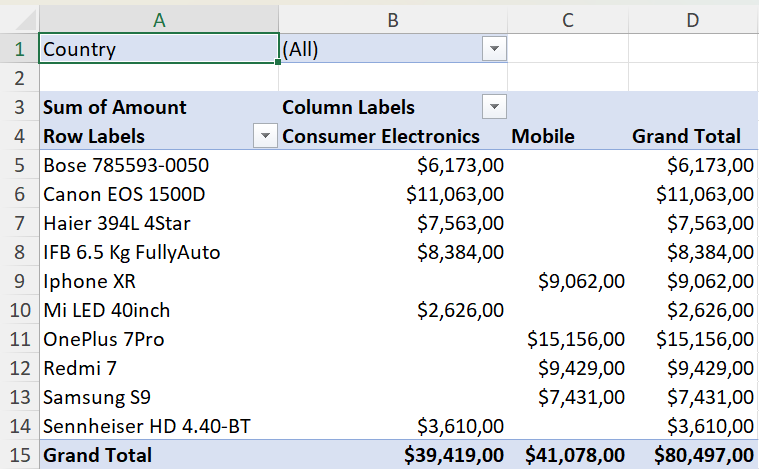
This setup creates a pivot table where:
Product = rows
Category = columns
Amount = summarized totals
Country = filter
IPivotField fieldCategory = pivotTable.PivotFields["Category"];
fieldCategory.Orientation = PivotFieldOrientation.ColumnField;

IPivotField fieldProduct = pivotTable.PivotFields["Product"];
fieldProduct.Orientation = PivotFieldOrientation.RowField;

IPivotField fieldAmount = pivotTable.PivotFields["Amount"];
fieldAmount.Orientation = PivotFieldOrientation.DataField;
fieldAmount.NumberFormat = "$#,##0.00";

IPivotField fieldCountry = pivotTable.PivotFields["Country"];
fieldCountry.Orientation = PivotFieldOrientation.PageField;

// Optional: make the report sheet readable
pivotSheet.Range["A:D"].EntireColumn.AutoFit();
Final Pivot Table Output
When you open the generated workbook in Excel, you’ll see:
Pivot Source sheet: your raw dataset in
A1:F16.Pivot Report sheet: a pivot table beginning at
A1that:Lists Products down the left.
Shows Categories across the top.
Displays Sum of Amount in the values area.
Includes a Country filter dropdown.
6) Save the Workbook
You can save the workbook to XLSX format with the following code:
workbook.Save("CreatePivotTable.xlsx");Next Steps
Read the full documentation here.
Explore a full demo showcasing pivot tables here.