


Add Charts to Excel XLSX Files Programmatically
This tutorial shows how to programmatically transform raw worksheet data into Excel charts in .NET applications using C# and the XLSX API, Document Solutions for Excel .NET (DsExcel .NET).
You’ll learn how to:
Add a new worksheet dedicated to charts
Insert a chart using the AddChart() method
Build chart series from worksheet ranges
Format chart axes, including number formats and labels
Export a final workbook containing a rendered Excel chart
Prerequisites
.NET SDK
Document Solutions for Excel .NET (DsExcel .NET)
The DS.Documents.Excel NuGet package installed in your project
After downloading the proper NuGet packages, apply the proper using statements:
using GrapeCity.Documents.Excel;
using GrapeCity.Documents.Excel.Drawing;
1) Create a Chart Worksheet
First, create a workbook and add a dedicated worksheet for the chart.
Workbook workbook = new Workbook();

IWorksheet chartSheet = workbook.Worksheets.Add();
chartSheet.Name = "Chart";
2) Add Sample Data for the Chart
Charts require a data range. Here, we’ll add a small dataset that includes labels and values.
chartSheet.Range["A1:D6"].Value = new object[,]
{
    { null, "Q1", "Q2", "Q3" },
    { "Belgium", 10, 25, 25 },
    { "France", -51, -36, 27 },
    { "Greece", 52, -85, -30 },
    { "Italy", 22, 65, 65 },
    { "UK", 23, 69, 69 },
};
Optional formatting for readability:
chartSheet.Range["B1:D1"].HorizontalAlignment = HorizontalAlignment.Right;
chartSheet.Range["B1:D1"].Font.Bold = true;
chartSheet.Range["B2:D6"].NumberFormat = "€#,##0";
3) Add an Excel Chart with AddChart(...)
Use the Shapes.AddChart() method to insert a chart object into the worksheet.
IShape shape = chartSheet.Shapes.AddChart(
    ChartType.ColumnClustered,
    300,
    10,
    300,
    300
);

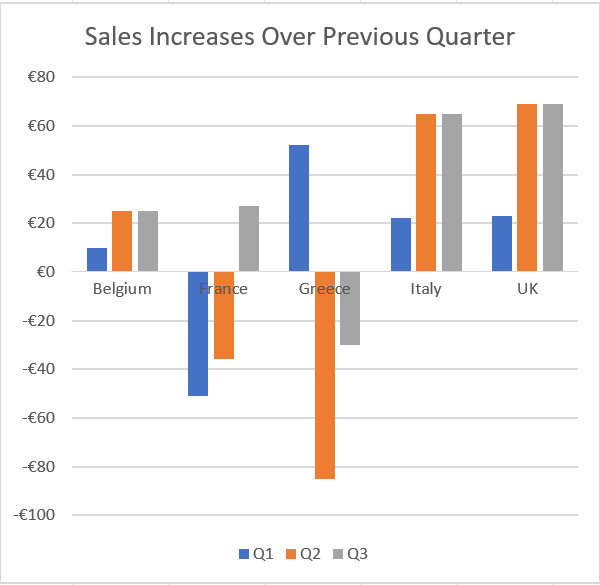
shape.Chart.ChartTitle.Text = "Sales Increases Over Previous Quarter";
4) Create Chart Series from Worksheet Ranges
Now connect the chart to your data range by creating a series collection from a worksheet range.
shape.Chart.SeriesCollection.Add(
    chartSheet.Range["A1:D6"],
    RowCol.Columns,
    true,
    true
);
This tells DsExcel to treat the dataset as:
Series grouped by columns
First row contains category labels: Q1, Q2, Q3
First column contains series names: Belgium, France, etc.
5) Format the Chart Axis
You can format the value axis to match your dataset’s number formatting.
IAxis valueAxis = shape.Chart.Axes.Item(AxisType.Value);
valueAxis.TickLabels.NumberFormat = "€#,##0";
Final Rendered Chart Output
When you open the generated workbook in Excel, the Chart worksheet will contain:
A clustered column chart
A chart title
Multiple series, such as Belgium, France, Greece, Italy, and UK
Q1/Q2/Q3 category labels
A formatted value axis using the specified currency format
6) Save the Workbook
You can save the workbook in XLSX format with the following code:
workbook.Save("ExcelChart.xlsx");Next Steps
Read the full documentation here.
Explore a full demo showcasing this feature here.
Related content