


Apply Styles, Formatting, and Conditional Formatting
This tutorial demonstrates how to programmatically control the formatting and visual presentation of Excel (.xslx) workbooks using C# and the .NET Excel API library, Document Solutions for Excel .NET (DsExcel .NET).
You’ll learn how to:
Create and reuse custom named styles.
Apply currency and percentage number formats.
Configure fonts, alignment, borders, and background fills.
Add conditional formatting using data bars.
Adjust column widths and row heights.
Hide worksheet gridlines for a cleaner, report-ready layout.
Save the formatted workbook as an Excel file.
Prerequisites
Before you begin, make sure you have:
.NET SDK
Document Solutions for Excel .NET (DsExcel .NET)
The DS.Documents.Excel NuGet package installed in your project
Import the required namespace:
using GrapeCity.Documents.Excel;1) Create a Workbook and Add Sample Data
Start by creating a workbook and renaming the default worksheet.
Workbook workbook = new Workbook();

IWorksheet worksheet = workbook.Worksheets[0];
worksheet.Name = "Formatting";
Next, add sample income and expense data. The worksheet will also include formulas that calculate total income, total expenses, and the percentage of income spent.
object[,] incomeData =
{
    { "ITEM", "AMOUNT" },
    { "Income 1", 2500 },
    { "Income 2", 1000 },
    { "Income 3", 250 },
    { "Other", 250 }
};

object[,] expenseData =
{
    { "ITEM", "AMOUNT" },
    { "Rent/mortgage", 800 },
    { "Electricity", 120 },
    { "Gas", 50 },
    { "Cell phone", 45 },
    { "Groceries", 500 },
    { "Car payment", 273 }
};

// Add section labels and data.
worksheet.Range["B2"].Value = "Income";
worksheet.Range["B9"].Value = "Expenses";

worksheet.Range["B3:C7"].Value = incomeData;
worksheet.Range["B10:C16"].Value = expenseData;

// Add total formulas.
worksheet.Range["B8"].Value = "Total";
worksheet.Range["C8"].Formula = "=SUM(C4:C7)";

worksheet.Range["B17"].Value = "Total";
worksheet.Range["C17"].Formula = "=SUM(C11:C16)";

// Add a summary section.
worksheet.Range["F2"].Value = "Income Spent";
worksheet.Range["F2:H2"].Merge();
worksheet.Range["F3:H3"].Merge();
Using range-based formulas such as =SUM(C4:C7) makes calculations easier to read and maintain than listing each cell separately.
2) Create and Reuse Custom Named Styles
DsExcel .NET allows you to create custom named styles and store them in the workbook’s Styles collection. You can then apply the same style to multiple cells or ranges.
Create a Currency Style
The currency style applies a currency number format and aligns values to the left.
IStyle currencyStyle = workbook.Styles.Add("CustomCurrency");

currencyStyle.HorizontalAlignment = HorizontalAlignment.Left;
currencyStyle.VerticalAlignment = VerticalAlignment.Bottom;
currencyStyle.NumberFormat = "$#,##0.00";

currencyStyle.IncludeAlignment = true;
currencyStyle.IncludeNumber = true;
Create a Heading Style
The heading style applies font settings, alignment, and a background fill.
IStyle headingStyle = workbook.Styles.Add("CustomHeading");

headingStyle.HorizontalAlignment = HorizontalAlignment.Center;
headingStyle.VerticalAlignment = VerticalAlignment.Center;

headingStyle.Font.Name = "Century Gothic";
headingStyle.Font.Bold = true;
headingStyle.Font.Size = 11;
headingStyle.Font.Color = Color.White;

headingStyle.Interior.Color = Color.FromArgb(32, 61, 64);

headingStyle.IncludeAlignment = true;
headingStyle.IncludeFont = true;
headingStyle.IncludePatterns = true;
Create a Percentage Style
The percentage style displays the calculated percentage using a larger, bold font and a percentage number format.
IStyle percentStyle = workbook.Styles.Add("CustomPercent");

percentStyle.HorizontalAlignment = HorizontalAlignment.Center;
percentStyle.VerticalAlignment = VerticalAlignment.Center;

percentStyle.Font.Name = "Century Gothic";
percentStyle.Font.Bold = true;
percentStyle.Font.Size = 14;
percentStyle.Font.Color = Color.FromArgb(32, 61, 64);

percentStyle.NumberFormat = "0.00%";

percentStyle.IncludeAlignment = true;
percentStyle.IncludeFont = true;
percentStyle.IncludeNumber = true;
3) Apply Number Formats and Styles
Apply the custom currency style to the cells containing income and expense amounts.
worksheet.Range["C4:C8,C11:C17"].Style = currencyStyle;Apply the heading style to the income and expense table headers.
worksheet.Range["B3,C3,B10,C10"].Style = headingStyle;Next, calculate the percentage of total income that was spent and apply the percentage style.
worksheet.Range["F3"].Formula = "=C17/C8";
worksheet.Range["F3"].Style = percentStyle;
Because the percentage number format is included in percentStyle, a separate assignment to the NumberFormat property is not required.
4) Add Borders and Background Fills
You can also format individual ranges directly when creating a reusable named style is not necessary.
Add a bottom border below the income total row:
IBorder incomeBorder =
    worksheet.Range["A8:D8"].Borders[BordersIndex.EdgeBottom];

incomeBorder.LineStyle = BorderLineStyle.Medium;
incomeBorder.Color = Color.FromArgb(32, 61, 64);
Add a bottom border below the expense total row:
IBorder expenseBorder =
    worksheet.Range["A17:D17"].Borders[BordersIndex.EdgeBottom];

expenseBorder.LineStyle = BorderLineStyle.Medium;
expenseBorder.Color = Color.FromArgb(32, 61, 64);
Apply a dark background fill and white, bold text to the section headings:
IRange sectionHeadings = worksheet.Range["B2,B9,F2"];

sectionHeadings.Interior.Color = Color.FromArgb(32, 61, 64);
sectionHeadings.Font.Color = Color.White;
sectionHeadings.Font.Bold = true;
sectionHeadings.HorizontalAlignment = HorizontalAlignment.Center;
sectionHeadings.VerticalAlignment = VerticalAlignment.Center;
5) Add Conditional Formatting with Data Bars
Conditional formatting helps readers compare values visually. In this example, a data bar rule is applied to the expense amounts.
IDataBar dataBar =
    worksheet.Range["C11:C16"]
        .FormatConditions
        .AddDatabar();

dataBar.MinPoint.Type = ConditionValueTypes.LowestValue;
dataBar.MinPoint.Value = null;

dataBar.MaxPoint.Type = ConditionValueTypes.HighestValue;
dataBar.MaxPoint.Value = null;

dataBar.BarFillType = DataBarFillType.Gradient;
dataBar.BarColor.Color = Color.Red;
dataBar.ShowValue = true;
The length of each data bar is based on the corresponding expense value. Setting the ShowValue property property to true displays both the original numeric value and the data bar in each cell.
6) Adjust the Worksheet Layout
Set column widths and row heights to make the report easier to read.
worksheet.Range["B:B"].ColumnWidth = 22;
worksheet.Range["C:C"].ColumnWidth = 15;
worksheet.Range["F:H"].ColumnWidth = 14;

worksheet.Range["2:2"].RowHeight = 24;
worksheet.Range["9:9"].RowHeight = 24;
You can also hide worksheet gridlines to create a cleaner, report-style layout.
worksheet.SheetView.DisplayGridlines = false;7) Save the Workbook
Save the completed workbook as an .xlsx file.
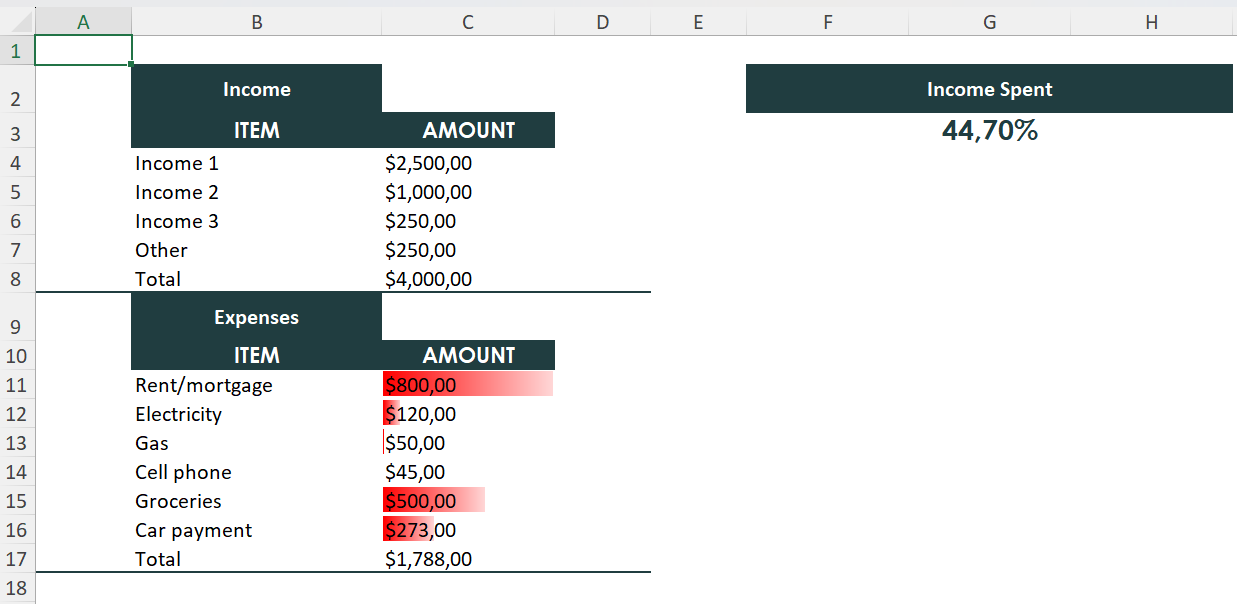
workbook.Save("FormattingAndConditionalFormatting.xlsx");When you open the generated workbook in Excel, you’ll see:
Formatted income and expense sections.
Reusable currency, heading, and percentage styles.
Summary rows with colored borders.
Section headings with dark background fills and white text.
Data bars that visually compare expense values.
Adjusted column widths and row heights.
A clean worksheet without gridlines.
The final worksheet looks as follows:
Next Steps
Read the full documentation on styles and conditional formatting.
Explore the demos: