
Moving Average Convergence Divergence
Moving Average Convergence Divergence (MACD) indicator for FinancialChart is a trend-following momentum indicator. It reveals changes in the strength, direction, duration and momentum of price of an asset. The indicator is efficient in helping users spot short-term price momentum.
MACD momentum oscillator displays a relationship between 26 day exponential moving average and 12 day exponential moving average. As the two moving averages converge, cross and diverge, they make the MACD oscillator to fluctuate above and below the zero line. A "signal line" is plotted on the top of the oscillator. It is a 9 day exponential moving average of MACD, which serves as a trigger for buy and sell signals. A sell signal is generated with the MACD going below the zero line.
MACD Histogram is an oscillator which measures the difference between the fast MACD line and the signal line. Just like MACD indicator, histogram also fluctuates above and below zero line. A positive histogram indicates that MACD is above its signal line, while MACD going below its signal line makes a negative histogram. A negative MACD Histograms generates sell signal.
To use MACD indicator and MACD Histogram in FinancialChart, add a FinancialChart control to your application and bind it to an appropriate data source or populate data in it through Quote Collection. The ItemsSource object enables data binding or populating data in FinancialChart. The MacdBase class exposes FastPeriod, SlowPeriod, and Smoothing period properties. Based on the values of these properties, data points for Macd indicator and Histogram are calculated and plotted on FinancialChart. The appearance of the series can be manipulated with MacdLineStyle and SignalLineStyle properties.
FinancialChart also enables you to fetch the calculated Macd values, Macd x values, Signal values, and Signal x values at run-time. This can help in creating alerts in application or maintaining logs while working with dynamic data.
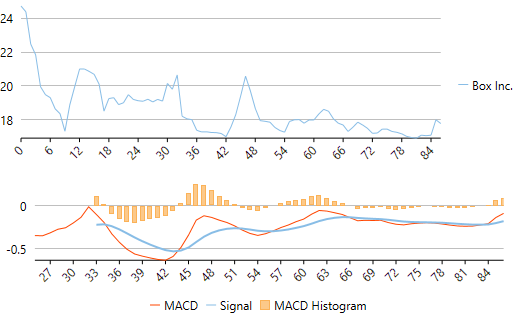
The following example considers stock data for a company Box Inc. over a period of time and plots its MACD Indicator and MACD Histogram apart from the volume chart, as shown in the image above. The example uses data from a json file, and DataService.cs class is created to access this json file.
Make sure that Build Action property of the json file is set to Embedded Resource.
PRICECHART
<Window xmlns:c1="http://schemas.componentone.com/winfx/2006/xaml"
x:Class="MACDInd.MainWindow"
xmlns="http://schemas.microsoft.com/winfx/2006/xaml/presentation"
xmlns:x="http://schemas.microsoft.com/winfx/2006/xaml"
xmlns:d="http://schemas.microsoft.com/expression/blend/2008"
xmlns:mc="http://schemas.openxmlformats.org/markup-compatibility/2006"
xmlns:local="clr-namespace:MACDInd"
mc:Ignorable="d"
Title="MainWindow" Height="350" Width="525"
DataContext="{Binding RelativeSource={RelativeSource Mode=Self}}">
<Grid>
<c1:C1FinancialChart x:Name="financialChart"
ItemsSource="{Binding Data}"
BindingX="Date"
ChartType="Line"
ToolTipContent="{}{seriesName}
{Date} {y}"
Margin="0,0,0,146"
Rendered="OnFinancialChartRendered">
<c1:FinancialSeries Binding="High,Low,Open,Close" SeriesName="Box Inc." />
<c1:C1FinancialChart.AxisX>
<c1:Axis LabelAngle="45" MajorUnit="3"/>
</c1:C1FinancialChart.AxisX>
</c1:C1FinancialChart>INDICATORCHART
<c1:C1FinancialChart x:Name="indicatorChart"
BindingX="Date"
Binding="High,Low,Close"
LegendPosition="Bottom"
ItemsSource="{Binding Data}"
Background="White"
ToolTipContent="{}{seriesName}
Date: {Date}
Y: {y:n2}
Volume: {Volume:n0}"
Margin="0,178,0,0">
<c1:Macd x:Name="Macd" SeriesName="MACD,Signal">
<c1:Macd.MacdLineStyle>
<c1:ChartStyle Stroke="OrangeRed" />
</c1:Macd.MacdLineStyle>
</c1:Macd>
<c1:MacdHistogram x:Name="MACDHistogram"
SeriesName= "MACD Histogram"
FastPeriod="12"
SlowPeriod="26"
SmoothingPeriod="9" />
<c1:C1FinancialChart.AxisX>
<c1:Axis LabelAngle="45" MajorUnit="3"/>
</c1:C1FinancialChart.AxisX>
</c1:C1FinancialChart>
</Grid>Make sure to add the following references in DataService.cs:
System.Collections.Generic
System.Linq
System.Runtime.Serialization.Json
System.Reflection
DATASERVICE
Public Class DataService
    Public Function GetData() As List(Of Quote)
        Dim path As String = "Indicator.Resources.box.json"
        'Replace Indicator by your application name
        Dim stream = Assembly.GetExecutingAssembly().GetManifestResourceStream(path)
        Dim ser = New DataContractJsonSerializer(GetType(Quote()))
        Dim data = DirectCast(ser.ReadObject(stream), Quote())
        Return data.ToList()
    End Function
    Shared _ds As DataService
    Public Shared Function GetService() As DataService
        If _ds Is Nothing Then
            _ds = New DataService()
        End If
        Return _ds
    End Function
End Class
csharp
public class DataService
{
    public List<Quote> GetData()
    {
        string path = "MACDInd.Resources.box.json";
        //Replace MACDInd by your application name
        var stream = Assembly.GetExecutingAssembly().GetManifestResourceStream(path);
        var ser = new DataContractJsonSerializer(typeof(Quote[]));
        var data = (Quote[])ser.ReadObject(stream);
        return data.ToList();
    }
    static DataService _ds;
    public static DataService GetService()
    {
        if (_ds == null)
            _ds = new DataService();
        return _ds;
    }
}
Json Data
[
    { "date": "01/23/15", "open": 20.2, "high": 24.73, "low": 20.16, "close": 23.23, "volume": 42593223 },
    { "date": "01/26/15", "open": 23.67, "high": 24.39, "low": 22.5, "close": 22.6, "volume": 8677164 },
    { "date": "01/27/15", "open": 22, "high": 22.47, "low": 21.17, "close": 21.3, "volume": 3272512 },
    { "date": "01/28/15", "open": 21.62, "high": 21.84, "low": 19.6, "close": 19.78, "volume": 5047364 },
    { "date": "01/29/15", "open": 19.9, "high": 19.95, "low": 18.51, "close": 18.8, "volume": 3419482 },
    { "date": "01/30/15", "open": 18.47, "high": 19.48, "low": 18.22, "close": 18.81, "volume": 2266439 },
    { "date": "02/02/15", "open": 19.18, "high": 19.3, "low": 18.01, "close": 18.02, "volume": 2071168 },
    { "date": "02/03/15", "open": 18.22, "high": 18.64, "low": 18.12, "close": 18.24, "volume": 1587435 },
    { "date": "02/04/15", "open": 18.2, "high": 18.35, "low": 17, "close": 17.1, "volume": 2912224 },
    { "date": "02/05/15", "open": 17.3, "high": 17.31, "low": 16.41, "close": 16.66, "volume": 2682187 },
    { "date": "02/06/15", "open": 17.39, "high": 18.88, "low": 17.21, "close": 18.12, "volume": 3929164 },
    { "date": "02/09/15", "open": 18.86, "high": 19.95, "low": 18.45, "close": 19.6, "volume": 3226650 },
    { "date": "02/10/15", "open": 20.5, "high": 21, "low": 19.63, "close": 20.99, "volume": 2804409 },
    { "date": "02/11/15", "open": 20.89, "high": 21, "low": 20.2, "close": 20.96, "volume": 1698365 },
    { "date": "02/12/15", "open": 20.66, "high": 20.85, "low": 19.75, "close": 20.17, "volume": 1370320 },
    { "date": "02/13/15", "open": 20.19, "high": 20.68, "low": 20, "close": 20.18, "volume": 711951 },
    { "date": "02/17/15", "open": 19.5, "high": 20.1, "low": 18.8, "close": 19.05, "volume": 2093602 },
    { "date": "02/18/15", "open": 18.31, "high": 18.5, "low": 17.96, "close": 18, "volume": 1849490 },
    { "date": "02/19/15", "open": 18.33, "high": 19.25, "low": 17.91, "close": 18.96, "volume": 1311518 },
    { "date": "02/20/15", "open": 18.68, "high": 19.3, "low": 18.65, "close": 18.85, "volume": 1001692 },
    { "date": "02/23/15", "open": 18.8, "high": 18.89, "low": 18.11, "close": 18.21, "volume": 670087 },
    { "date": "02/24/15", "open": 18.46, "high": 19, "low": 18.27, "close": 18.83, "volume": 759263 },
    { "date": "02/25/15", "open": 18.83, "high": 19.48, "low": 18.47, "close": 18.67, "volume": 915580 },
    { "date": "02/26/15", "open": 18.64, "high": 19.2, "low": 18.64, "close": 18.94, "volume": 461283 },
    { "date": "02/27/15", "open": 18.8, "high": 19.12, "low": 18.55, "close": 18.66, "volume": 617199 },
    { "date": "03/02/15", "open": 18.66, "high": 19.09, "low": 18.65, "close": 18.79, "volume": 519605 },
    { "date": "03/03/15", "open": 18.79, "high": 19.21, "low": 18.45, "close": 18.59, "volume": 832415 },
    { "date": "03/04/15", "open": 18.64, "high": 19.05, "low": 18.32, "close": 19, "volume": 539688 },
    { "date": "03/05/15", "open": 19.2, "high": 19.2, "low": 18.8, "close": 19.14, "volume": 486149 },
    { "date": "03/06/15", "open": 19.03, "high": 19.1, "low": 18.7, "close": 18.91, "volume": 685659 },
    { "date": "03/09/15", "open": 18.98, "high": 20.15, "low": 18.96, "close": 19.4, "volume": 1321363 },
    { "date": "03/10/15", "open": 19.3, "high": 19.8, "low": 18.85, "close": 19.64, "volume": 615743 },
    { "date": "03/11/15", "open": 20.08, "high": 20.65, "low": 19.24, "close": 20.53, "volume": 2167167 },
    { "date": "03/12/15", "open": 17.17, "high": 18.2, "low": 16.76, "close": 18.2, "volume": 6837638 },
    { "date": "03/13/15", "open": 18.05, "high": 18.05, "low": 17.3, "close": 17.88, "volume": 1715629 },
    { "date": "03/16/15", "open": 17.91, "high": 18, "low": 17.01, "close": 17.13, "volume": 1321313 },
    { "date": "03/17/15", "open": 17.28, "high": 17.37, "low": 16.6, "close": 17.12, "volume": 1272242 },
    { "date": "03/18/15", "open": 17.1, "high": 17.27, "low": 16.91, "close": 17.01, "volume": 530063 },
    { "date": "03/19/15", "open": 17, "high": 17.28, "low": 17, "close": 17.06, "volume": 536427 },
    { "date": "03/20/15", "open": 17.13, "high": 17.24, "low": 16.88, "close": 17.21, "volume": 1320237 },
    { "date": "03/23/15", "open": 17.21, "high": 17.23, "low": 17.01, "close": 17.11, "volume": 509798 },
    { "date": "03/24/15", "open": 17.02, "high": 17.18, "low": 16.82, "close": 17, "volume": 962149 },
    { "date": "03/25/15", "open": 16.92, "high": 16.99, "low": 16.82, "close": 16.97, "volume": 565673 },
    { "date": "03/26/15", "open": 16.83, "high": 17.56, "low": 16.83, "close": 17.54, "volume": 884523 },
    { "date": "03/27/15", "open": 17.58, "high": 18.3, "low": 17.11, "close": 18.3, "volume": 705626 },
    { "date": "03/30/15", "open": 18.5, "high": 19.4, "low": 18.4, "close": 19.05, "volume": 1151620 },
    { "date": "03/31/15", "open": 19.08, "high": 20.58, "low": 18.4, "close": 19.75, "volume": 2020679 },
    { "date": "04/01/15", "open": 19.69, "high": 19.69, "low": 18.55, "close": 18.65, "volume": 961078 },
    { "date": "04/02/15", "open": 18.56, "high": 18.66, "low": 17.85, "close": 17.9, "volume": 884233 },
    { "date": "04/06/15", "open": 17.78, "high": 17.94, "low": 17.51, "close": 17.66, "volume": 605252 },
    { "date": "04/07/15", "open": 17.62, "high": 17.9, "low": 17.53, "close": 17.61, "volume": 591988 },
    { "date": "04/08/15", "open": 17.64, "high": 17.85, "low": 17.32, "close": 17.36, "volume": 618855 },
    { "date": "04/09/15", "open": 17.33, "high": 17.54, "low": 17.1, "close": 17.1, "volume": 761855 },
    { "date": "04/10/15", "open": 17.08, "high": 17.36, "low": 17, "close": 17.05, "volume": 568373 },
    { "date": "04/13/15", "open": 17.24, "high": 17.26, "low": 16.81, "close": 17.1, "volume": 667142 },
    { "date": "04/14/15", "open": 17.1, "high": 17.89, "low": 17.02, "close": 17.52, "volume": 870138 },
    { "date": "04/15/15", "open": 17.6, "high": 17.99, "low": 17.5, "close": 17.69, "volume": 530456 },
    { "date": "04/16/15", "open": 17.95, "high": 18, "low": 17.6, "close": 17.82, "volume": 548730 },
    { "date": "04/17/15", "open": 17.75, "high": 17.79, "low": 17.5, "close": 17.79, "volume": 446373 },
    { "date": "04/20/15", "open": 17.63, "high": 17.98, "low": 17.52, "close": 17.93, "volume": 487017 },
    { "date": "04/21/15", "open": 17.96, "high": 17.98, "low": 17.71, "close": 17.92, "volume": 320302 },
    { "date": "04/22/15", "open": 17.88, "high": 18.33, "low": 17.57, "close": 18.29, "volume": 644812 },
    { "date": "04/23/15", "open": 18.29, "high": 18.61, "low": 18.18, "close": 18.28, "volume": 563879 },
    { "date": "04/24/15", "open": 18.5, "high": 18.5, "low": 17.61, "close": 17.75, "volume": 650762 },
    { "date": "04/27/15", "open": 17.97, "high": 18.05, "low": 17.45, "close": 17.57, "volume": 437294 },
    { "date": "04/28/15", "open": 17.65, "high": 17.79, "low": 17.39, "close": 17.5, "volume": 224519 },
    { "date": "04/29/15", "open": 17.68, "high": 17.68, "low": 17.1, "close": 17.21, "volume": 495706 },
    { "date": "04/30/15", "open": 17.22, "high": 17.3, "low": 17, "close": 17.11, "volume": 391040 },
    { "date": "05/01/15", "open": 17.11, "high": 17.55, "low": 16.85, "close": 17.5, "volume": 563075 },
    { "date": "05/04/15", "open": 17.56, "high": 17.85, "low": 17.3, "close": 17.4, "volume": 253138 },
    { "date": "05/05/15", "open": 17.68, "high": 17.68, "low": 17.09, "close": 17.43, "volume": 290935 },
    { "date": "05/06/15", "open": 17.48, "high": 17.48, "low": 17, "close": 17.04, "volume": 313662 },
    { "date": "05/07/15", "open": 17.05, "high": 17.19, "low": 16.92, "close": 17.04, "volume": 360284 },
    { "date": "05/08/15", "open": 17.13, "high": 17.21, "low": 16.91, "close": 17.1, "volume": 297653 },
    { "date": "05/11/15", "open": 17.16, "high": 17.44, "low": 17.13, "close": 17.31, "volume": 268504 },
    { "date": "05/12/15", "open": 17.28, "high": 17.44, "low": 16.99, "close": 17.24, "volume": 376961 },
    { "date": "05/13/15", "open": 17.24, "high": 17.3, "low": 17.06, "close": 17.2, "volume": 244617 },
    { "date": "05/14/15", "open": 17.24, "high": 17.25, "low": 17.02, "close": 17.08, "volume": 252526 },
    { "date": "05/15/15", "open": 17.06, "high": 17.16, "low": 16.95, "close": 16.95, "volume": 274783 },
    { "date": "05/18/15", "open": 16.95, "high": 17.01, "low": 16.76, "close": 16.87, "volume": 418513 },
    { "date": "05/19/15", "open": 16.93, "high": 16.94, "low": 16.6, "close": 16.83, "volume": 367660 },
    { "date": "05/20/15", "open": 16.8, "high": 16.9, "low": 16.65, "close": 16.86, "volume": 297914 },
    { "date": "05/21/15", "open": 16.9, "high": 17.08, "low": 16.79, "close": 16.88, "volume": 229346 },
    { "date": "05/22/15", "open": 16.9, "high": 17.05, "low": 16.85, "close": 17, "volume": 253279 },
    { "date": "05/26/15", "open": 17.03, "high": 17.08, "low": 16.86, "close": 17.01, "volume": 212640 },
    { "date": "05/27/15", "open": 17.01, "high": 17.99, "low": 16.87, "close": 17.75, "volume": 857109 },
    { "date": "05/28/15", "open": 17.77, "high": 17.77, "low": 17.44, "close": 17.62, "volume": 338482 }
]
Make sure to add the following references in code view:
System.Collections.Generic
System.Windows
System.Runtime.Serialization
<DataContract>
Public Class Quote
    <DataMember(Name:="date")>
    Public Property [Date]() As String
        Get
            Return m_Date
        End Get
        Set
            m_Date = Value
        End Set
    End Property
    Private m_Date As String
    <DataMember(Name:="high")>
    Public Property High() As Double
        Get
            Return m_High
        End Get
        Set
            m_High = Value
        End Set
    End Property
    Private m_High As Double
    <DataMember(Name:="low")>
    Public Property Low() As Double
        Get
            Return m_Low
        End Get
        Set
            m_Low = Value
        End Set
    End Property
    Private m_Low As Double
    <DataMember(Name:="open")>
    Public Property Open() As Double
        Get
            Return m_Open
        End Get
        Set
            m_Open = Value
        End Set
    End Property
    Private m_Open As Double
    <DataMember(Name:="close")>
    Public Property Close() As Double
        Get
            Return m_Close
        End Get
        Set
            m_Close = Value
        End Set
    End Property
    Private m_Close As Double
    <DataMember(Name:="volume")>
    Public Property Volume() As Double
        Get
            Return m_Volume
        End Get
        Set
            m_Volume = Value
        End Set
    End Property
    Private m_Volume As Double
End Class
''' Interaction logic for Macd.xaml
Partial Public Class Macd
    Inherits Window
    Private dataService As DataService = dataService.GetService()
    Public Sub New()
        InitializeComponent()
    End Sub
    Public ReadOnly Property Data() As List(Of Quote)
        Get
            Return dataService.GetData()
        End Get
    End Property
    Private Sub OnFinancialChartRendered(sender As Object, e As C1.WPF.Chart.RenderEventArgs)
        indicatorChart.AxisX.Min = DirectCast(financialChart.AxisX, IAxis).GetMin()
        indicatorChart.AxisX.Max = DirectCast(financialChart.AxisX, IAxis).GetMax()
    End Sub
End Class[DataContract]
public class Quote
{
[DataMember(Name = "date")]
public string Date { get; set; }
[DataMember(Name = "high")]
public double High { get; set; }
[DataMember(Name = "low")]
public double Low { get; set; }
[DataMember(Name = "open")]
public double Open { get; set; }
[DataMember(Name = "close")]
public double Close { get; set; }
[DataMember(Name = "volume")]
public double Volume { get; set; }
}
/// Interaction logic for MainWindow.xaml
public partial class MainWindow : Window
{
DataService dataService = DataService.GetService();
public MainWindow()
{
InitializeComponent();
}
public List<Quote> Data
{
get
{
return dataService.GetData();
}
}
private void OnFinancialChartRendered(object sender, C1.WPF.Chart.RenderEventArgs e)
{
indicatorChart.AxisX.Min = ((IAxis)financialChart.AxisX).GetMin();
indicatorChart.AxisX.Max = ((IAxis)financialChart.AxisX).GetMax();
}
}