-
Chart for WPF and Silverlight
- Getting Started
- Concepts and Main Properties
- Chart Types
-
Chart Features
- Animation
- Axis
- Chart Legend
- Chart View
- Data Binding
- Data Point Converter
- Data Labels
- Data Series 1
- Empty Values
- Grouping Aggregation
- Interaction
- Markers Labels
- Multiple Plot Areas
- Performance Optimization
- Plotting Functions
- Saving and Exporting C1Chart
- Series Generation
- Style and Appearance
- Time-Series Charts
- Trend Lines
- Tutorials
Custom Axis Annotation
In some situations you may need to create custom axis annotation. The following scenarios can be useful for creating custom axis annotation:
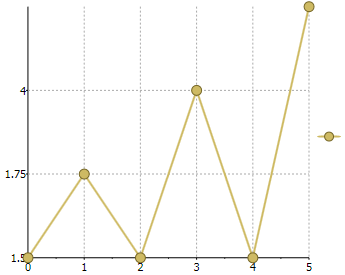
When the ItemsSource property is a collection of numbers or DateTime values the chart uses these values as axis labels. The following code uses the ItemsSource property to create the custom Y-axis labels:
c1Chart1.Reset(true);
        c1Chart1.Data.Children.Add(
          new DataSeries() { ValuesSource = new double[] { 1, 2, 1, 3, 1, 4 } });
        c1Chart1.ChartType = ChartType.LineSymbols;
        c1Chart1.View.AxisY.ItemsSource = new double[] { 1.25, 1.5, 1.75, 4 };
Here is what the chart appears like after adding the preceding code:
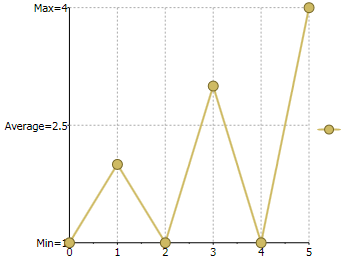
c1Chart1.Reset(true);
        c1Chart1.Data.Children.Add(
          new DataSeries() { ValuesSource = new double[] { 1, 2, 1, 3, 1, 4 } });
        c1Chart1.ChartType = ChartType.LineSymbols;
        c1Chart1.View.AxisY.ItemsSource = new List<KeyValuePair<object,double>>
          { new KeyValuePair<object,double>("Min=1", 1),
            new KeyValuePair<object,double>("Average=2.5", 2.5),
            new KeyValuePair<object,double>("Max=4", 4)};
Here is what the chart appears like after adding the preceding code:
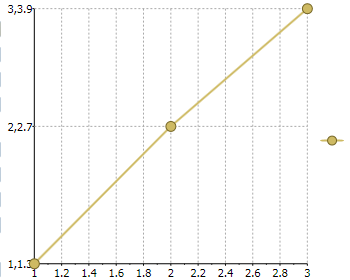
You can use the ItemsValueBinding and ItemsLabelBinding properties to create axis labels using arbitrary collection as data source, like in the following code:
c1Chart1.Reset(true);
        Point[] pts = new Point[] { new Point(1, 1.3), new Point(2, 2.7), new Point(3, 3.9) };
        c1Chart1.DataContext = pts;
        c1Chart1.ChartType = ChartType.LineSymbols;
        c1Chart1.View.AxisY.ItemsSource = pts;
        c1Chart1.View.AxisY.ItemsValueBinding = new Binding("Y");
        c1Chart1.View.AxisY.ItemsLabelBinding = new Binding();
Here is what the chart appears like after adding the preceding code: