
-
Chart for WPF and Silverlight
- Getting Started
- Concepts and Main Properties
- Chart Types
-
Chart Features
- Animation
- Axis
- Chart Legend
- Chart View
- Data Binding
- Data Point Converter
- Data Labels
- Data Series 1
- Empty Values
- Grouping Aggregation
- Interaction
- Markers Labels
- Multiple Plot Areas
- Performance Optimization
- Plotting Functions
- Saving and Exporting C1Chart
- Series Generation
- Style and Appearance
- Time-Series Charts
- Trend Lines
- Tutorials
Logarithmic Scaling
When data is shown with large differences in scale or when data is expected to vary exponentially on the same chart, it is often convenient to use logarithmic scaling on one or more axes. On a logarithmic axis, equal distance along it depicts an equal percentage change. If logarithmic scaling is used on one or both axes, the chart is called a Log Scale chart.
With logarithmic scaling, values are physically spaced based upon the logarithm of the value instead of the value itself. This is useful when quantities are charted over a very wide range, and when depiction of geometric and/or exponential relationships is desired.
Unlike arithmetic charts where changes are measured in terms of direct units, log scale charts show changes in terms of percentage change. For example, in a log scale chart measuring dollars, a change from $1 to $2 is a 100 percent change so the distance on the chart axis from $1 to $2 would be the same from $50 to $100. Whereas in an arithmetic chart, a change from $50 to $100 would make the distance on the axis from $50 to $100 appear much larger on the chart because it is a change of $50 as opposed to just $1.
Commonly Used Logarithms
Logarithms can be expressed using any base value, including integers and floating point values. The two most commonly used types of logarithms include:
- Common logarithms – Use 10 as the base so it’s written as log 100 = 2.
- Natural logarithms –Use the mathematical constant e as the base.
Logarithmic Base
You can specify the value for the logarithmic base using the LogBase property. The default value is double.Nan which corresponds to the default linear axis. A natural logarithm is the logarithm to the base e. Note that Logarithmic scaling does not make mathematical sense when values are less than or equal to zero.
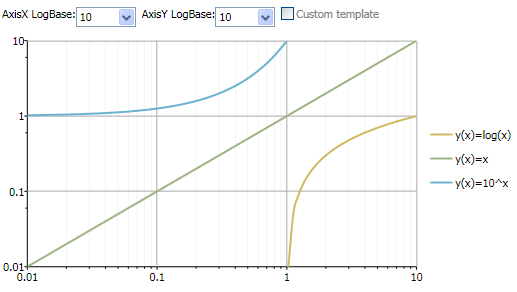
The following image shows how C1Chart appears when the LogBase is set to 10 for the X-Axis and Y-Axis, which is the common logarithm:
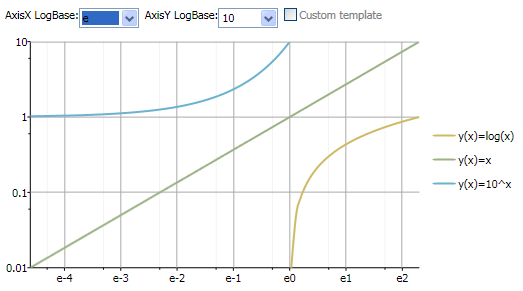
The following image shows how C1Chart appears when the LogBase for the X-Axis is e and the LogBase for the Y-Axis is 10:
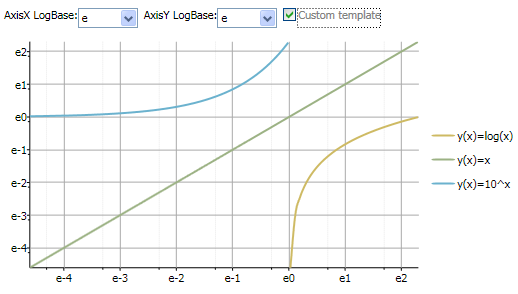
The following image shows how C1Chart appears when the LogBase for the X-Axis is e and the LogBase for the Y-Axis is e:
The following additional criteria must be following for logarithmic axes:
- Any data that is less than or equal to zero is not graphed (it is treated as a data hole), since a logarithmic axis only handles data values that are greater than zero. For the same reason, axis and data minimum/maximum bounds and origin properties cannot be set to zero or less.
- Axis numbering increment, ticking increment, and precision properties have no effect when the axis is logarithmic.
- For a logarithmic X-axis, the chart type must be either plot, bubble, area, HiLo, HiLoOpenClose or candle. For the Y-axis, the chart type must be either plot, bubble, area, polar, HiLo, HiLoOpenClose, candle, radar or filled radar.