
-
Chart for WPF and Silverlight
- Getting Started
- Concepts and Main Properties
- Chart Types
-
Chart Features
- Animation
- Axis
- Chart Legend
- Chart View
- Data Binding
- Data Point Converter
- Data Labels
- Data Series 1
- Empty Values
- Grouping Aggregation
- Interaction
- Markers Labels
- Multiple Plot Areas
- Performance Optimization
- Plotting Functions
- Saving and Exporting C1Chart
- Series Generation
- Style and Appearance
- Time-Series Charts
- Trend Lines
- Tutorials
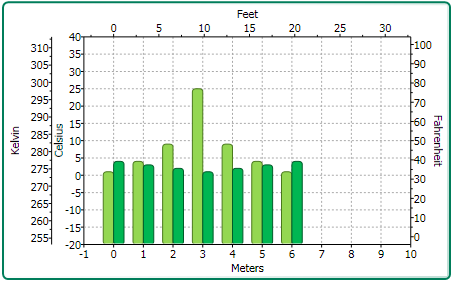
Multiple Axis
Multiple axes are commonly used when you have the following:
- Two or more Data Series that have mixed types of data which make the scales very different
- Wide range of data values that vary from Data Series to Data Series
The following chart uses five axes to effectively display the length and temperature in both metric and non-metric measurements:
You can add multiple axes to the chart by adding a new Axis object and then specifying its type (X, Y, or Z) for the AxisType property.
The following XAML markup shows how to add multiple Y-axes to the chart:
<c1chart:C1Chart Margin="0" Name="c1Chart1">
  <c1chart:C1Chart.View>
    <c1chart:ChartView>
      <!-- Auxiliary y-axes -->
      <c1chart:Axis Name="ay2" AxisType="Y" Position="Far" Min="0" Max="10" />
      <c1chart:Axis Name="ay3" AxisType="Y" Position="Far" Min="0" Max="20" />
      <c1chart:Axis Name="ay4" AxisType="Y" Position="Far" Min="0" Max="50" />
    </c1chart:ChartView>
  </c1chart:C1Chart.View>
  <c1chart:C1Chart.Data>
    <c1chart:ChartData>
      <c1chart:DataSeries Values="1 2 3 4 5" />
      <c1chart:DataSeries AxisY="ay2" Values="1 2 3 4 5" />
      <c1chart:DataSeries AxisY="ay3" Values="1 2 3 4 5" />
      <c1chart:DataSeries AxisY="ay4" Values="1 2 3 4 5" />
    </c1chart:ChartData>
  </c1chart:C1Chart.Data>
</c1chart:C1Chart>