
-
Chart for WPF and Silverlight
- Getting Started
- Concepts and Main Properties
- Chart Types
-
Chart Features
- Animation
- Axis
- Chart Legend
- Chart View
- Data Binding
- Data Point Converter
- Data Labels
- Data Series 1
- Empty Values
- Grouping Aggregation
- Interaction
- Markers Labels
- Multiple Plot Areas
- Performance Optimization
- Plotting Functions
- Saving and Exporting C1Chart
- Series Generation
- Style and Appearance
- Time-Series Charts
- Trend Lines
- Tutorials
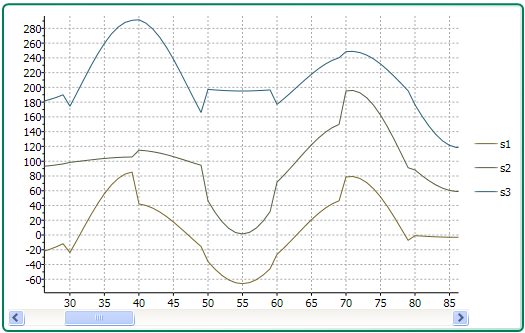
Scrolling
In circumstances when you have a substantial amount of X-values or Y-values in your chart data, you can add an AxisScrollBar control to the axes on your chart. Adding a scrollbar can make the data on the chart easier to read by scrolling through it so you can closely view pieces of data one at a time. The following image has the ScrollBar set to the View.AxisX.Value property.
A scrollbar can appear on the X-Axis or Y-Axis simply by setting the ScrollBar’s Value property to AxisX for the X-Axis or AxisY for the Y-Axis.
The following XAML code shows how to assign a horizontal scrollbar to the X-Axis:
<c1chart:C1Chart Name="c1Chart1">
    <c1chart:C1Chart.View>
      <c1chart:ChartView>
        <c1chart:ChartView.AxisX>
          <c1chart:Axis Scale="0.2">
            <c1chart:Axis.ScrollBar>
              <c1chart:AxisScrollBar />
            </c1chart:Axis.ScrollBar>
          </c1chart:Axis>
        </c1chart:ChartView.AxisX>
      </c1chart:ChartView>
    </c1chart:C1Chart.View>
Setting the minimum and maximum values for the Scrollbar will prevent the scrollbar from changing the Axis values when you are scrolling.