


Axis Labels
Axis Labels represent the major divisions along an axis. Labels on a category axis display category names, while labels on a value axis display numeric values.
FlexChart automatically generates axis labels from the chart data. When the available space is limited, FlexChart can hide labels to prevent overlap.
Use the following properties to configure axis labels:
LabelMax specifies whether the maximum axis label is always displayed.
LabelMin specifies whether the minimum axis label is always displayed.
Axis.RoundLimits adjusts the axis limits to align with the MajorUnit interval.
Labels controls label visibility.
LabelAlignment positions labels relative to the tick marks.
Format defines the label format.
The following code example configures FlexChart axis labels. It sets the label format, alignment, interval, and maximum axis level.
//Specifies label position relative to its axis line
flexChart1.AxisX.LabelAlignment = AxisLabelAlignment.Top;
flexChart1.AxisY.Format = "#,##0,,";
//Displays max axis value
flexChart1.AxisY.LabelMax = true;
//Rounds off max axis value
flexChart1.AxisY.RoundLimits = true;
'Specifies label position relative to its axis line
Me.flexChart1.AxisX.LabelAlignment = AxisLabelAlignment.Top
Me.flexChart1.AxisY.Format = "#,##0,,"
'Displays max axis value
Me.flexChart1.AxisY.LabelMax = true
'Rounds off max axis value
Me.flexChart1.AxisY.RoundLimits = true Custom Format Axis Labels
In addition to the standard formats supported by the Format property, FlexChart supports custom axis-label formatting through the Axis.Formatter property.
The Formatter property accepts a custom formatter that determines the label output.
The following image shows custom formatting applied to Y-axis labels.
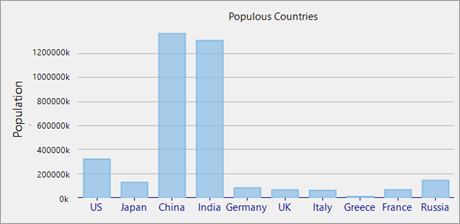
The associated example defines a custom formatter named CustomAxisLabelFormatter and assigns it to the Formatter property of the Y-axis.
//using a custom formatter, to format the Axis labels
this.flexChart1.AxisY.Formatter = new CustomAxisLabelFormatter();
' using a custom formatter, to format the Axis labels
me.flexChart1.AxisY.Formatter = new CustomAxisLabelFormatter()The following code example defines the CustomAxisLabelFormatter class for custom label formatting.
internal class CustomAxisLabelFormatter : ICustomFormatter
{
    public string Format(string format, object arg, IFormatProvider formatProvider)
    {
        //applying a custom format
        var formattedString = string.Format("{0:0,.#k}", arg);
        //returning the custom formatted string
        return formattedString;
    }
}
Friend Class CustomAxisLabelFormatter Inherits ICustomFormatter
Public Function Format(ByVal format As String, ByVal arg As Object, ByVal formatProvider As IFormatProvider) As String
Dim formattedString = String.Format("{0:0,.#k}", arg)
Return formattedString
End Function
End ClassOverlapping Labels
Axis labels can overlap when the label text is long or when the chart displays many labels in a limited area.
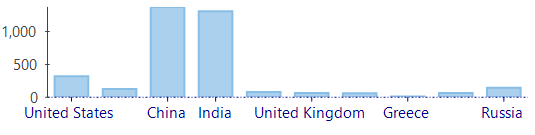
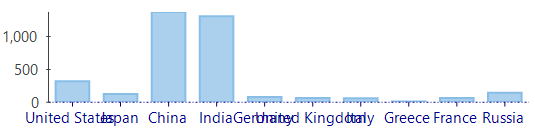
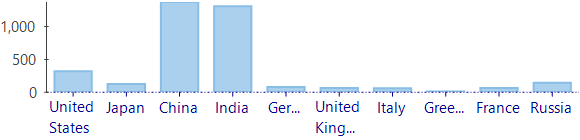
Use the Axis.OverlappingLabels property to configure how FlexChart handles overlapping labels. The property accepts values from the OverlappingLabels enumeration.
The default value, Auto, hides overlapping labels when the available space is limited. Other options support displaying, trimming, or wrapping the labels.
The following images show the available overlapping-label behaviors:
OverlappingLabel.Auto |
|---|
|
OverlappingLabel.Show |
|
OverlappingLabel.Trim |
|
OverlappingLabel.Wrap |
|

//Wrap the label text if it exceeds the available width
    this.flexChart1.AxisX.OverlappingLabels = OverlappingLabels.WordWrap;
' Wrap the label text if it exceeds the available width
me.flexChart1.AxisX.OverlappingLabels = OverlappingLabels.WordWrap Rotate Axis Labels
FlexChart supports vertical and angled axis labels.
Display Vertical Labels
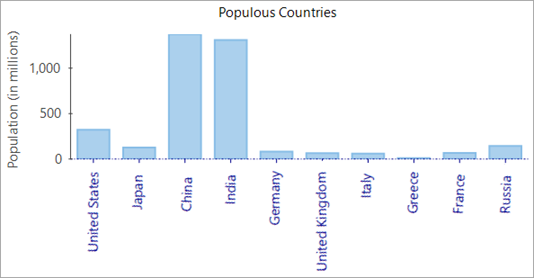
Set the Axis.Style.VerticalText property to true to display axis labels vertically instead of using the default horizontal orientation.
The following image shows vertically oriented X-axis labels:
//set the orientation of labels
this.flexChart1.AxisX.Style.VerticalText = true;
this.flexChart1.AxisY.Style.VerticalText = false;
' set the orientation of labels
me.flexChart1.AxisX.Style.VerticalText = true
me.flexChart1.AxisY.Style.VerticalText = falseSet the Label Angle
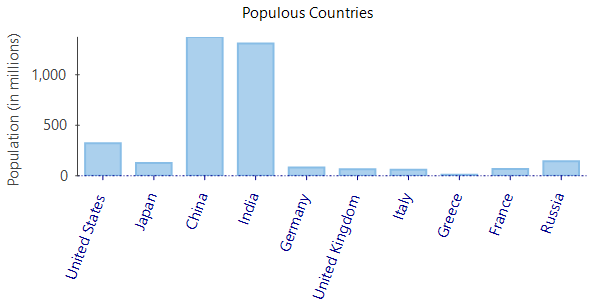
Use the LabelAngle property to rotate axis labels relative to the axis line. The property accepts values from -90 through 90 degrees and rotates the labels counterclockwise.
The following image shows axis labels rotated by an angle:
//Rotate the labels counter-clockwise by 70 degrees
    this.flexChart1.AxisX.LabelAngle = 70;
'Rotate the labels counter-clockwise by 70 degrees
me.flexChart1.AxisX.LabelAngle = 70 Staggered Axis Labels
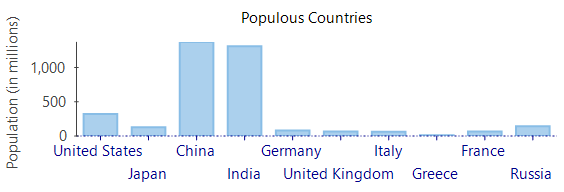
Set StaggeredLines to a value greater than 1 to specify the number of rows used for the labels.
The following image shows axis labels displayed across two staggered rows:
//Display the axis labels in staggered lines
    this.flexChart1.AxisX.StaggeredLines = 2;
'Display the axis labels in staggered lines
me.flexChart1.AxisX.StaggeredLines = 2