


Axis Elements
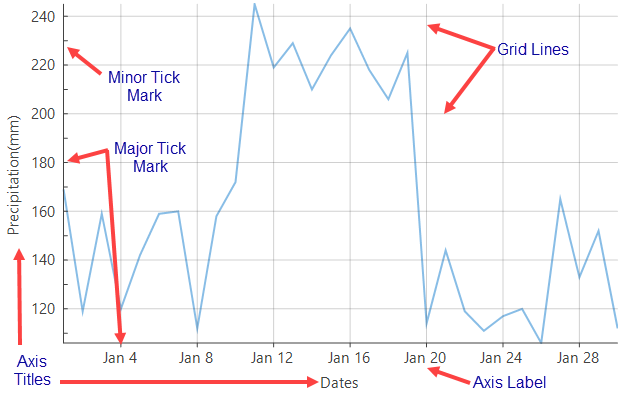
A chart axis includes elements such as the axis title, scale, tick marks, gridlines, and units. FlexChart provides properties for configuring these elements and controlling how data appears in the chart.
Axis Scale
Axis scale determines how values are distributed along an axis. FlexChart calculates the scale automatically based on the supplied data.
Use the following properties to configure the scale:
Min - specifies the minimum axis value.
Max - specifies the maximum axis value.
MajorUnit - specifies the interval between major axis divisions.
Note: Axis scale applies to value axes, not categorical axes.
//Setting axis bounds
this.flexChart1.AxisY.Max = 150;
this.flexChart1.AxisY.Min = 90;
this.flexChart1.AxisY.MajorUnit = 15;
' Setting axis bounds
me.flexChart1.AxisY.Max = 150
me.flexChart1.AxisY.Min = 90
me.flexChart1.AxisY.MajorUnit = 15Axis Title
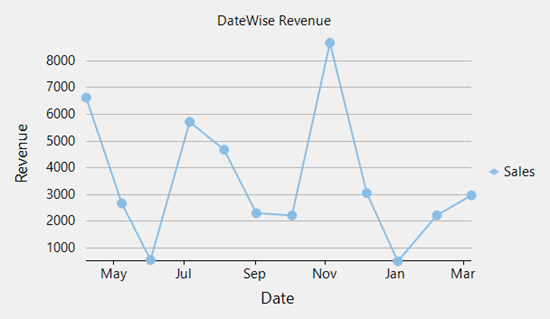
An axis title appears next to an axis and describes the data represented by that axis.
Set the title through the Axis.Title property. Use Axis.TitleStyle to customize its appearance.
The following image shows titles applied to the X-axis and Y-axis.
Note: The axis-title examples use the code and data source described in Quick Start.
flexChart1.AxisX.Title = "Date";
flexChart1.AxisY.Title = "Revenue";
flexChart1.AxisX.Title = "Date"
flexChart1.AxisY.Title = "Revenue"Rotate an Axis Title
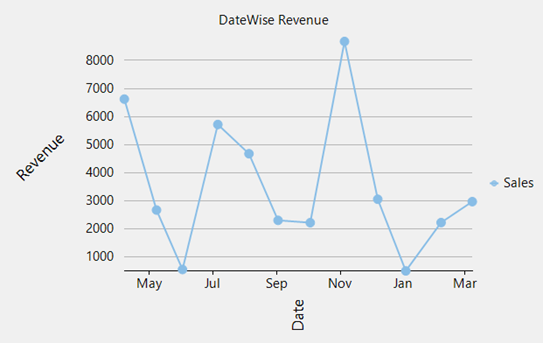
Use the TitleAngle property to rotate an axis title relative to the axis line. The property accepts values from -90 through 90 degrees and rotates the title counterclockwise by the specified angle.
// Rotate the title counter-clockwiseflexChart1.AxisX.TitleAngle = 90;
flexChart1.AxisY.TitleAngle = 45;
'Rotate the title counter-clockwiseflexChart1.AxisX.TitleAngle = 90
flexChart1.AxisY.TitleAngle = 45Style an Axis Title
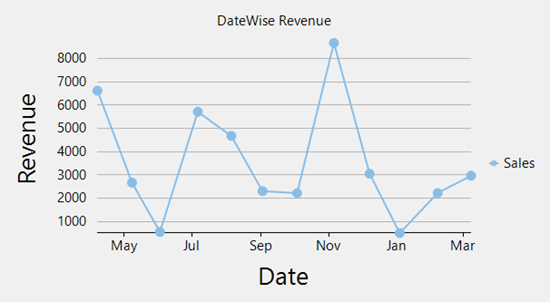
Use the TitleStyle property to configure the appearance of an axis title, including its font.
The following image shows custom styling applied to the axis titles.
flexChart1.AxisX.TitleStyle.Font = new Font(flexChart1.Font.FontFamily, 16);
flexChart1.AxisY.TitleStyle.Font = new Font(flexChart1.Font.FontFamily, 16);flexChart1.AxisX.TitleStyle.Font = new Font(flexChart1.Font.FontFamily, 16)
flexChart1.AxisY.TitleStyle.Font = new Font(flexChart1.Font.FontFamily, 16)Axis Units
FlexChart automatically calculates major and minor axis units when data is bound to the chart.
Use the following properties to modify the intervals:
Axis.MajorUnit specifies the interval between major axis divisions.
Axis.MinorUnit specifies the interval between minor axis divisions.
For a DateTime axis, use the TimeUnit property to specify a time interval such as day, week, month, quarter, or year. The property accepts values from the TimeUnits enumeration.
For example, to use a three-month major interval, set TimeUnit to Month and MajorUnit to 3.
//Setting MajorUnit and MinorUnit property to specify number of units between each axis label
this.flexChart1.AxisY.MajorUnit = 50;
this.flexChart1.AxisY.MinorUnit = 20;
'Setting MajorUnit and MinorUnit property to specify number of units between each axis label
Me.flexChart1.AxisY.MajorUnit = 50
Me.flexChart1.AxisY.MinorUnit = 20 Gridlines
Gridlines extend from tick marks and provide reference lines for interpreting chart values.
By default, FlexChart displays gridlines for the Y-axis but not for the X-axis.
Use the following properties to configure gridlines:
MajorGrid controls major-gridline visibility.
MinorGrid controls minor-gridline visibility.
MajorGridStyle configures major-gridline appearance.
MinorGridStyle connfigures minor-gridline appearance.
//Hiding horizontal GridLines for AxisY
this.flexChart1.AxisY.MajorGrid = false;
//Hiding vertical GridLines for AxisX
this.flexChart1.AxisX.MajorGrid = false;
'Hiding horizontal GridLines for AxisY
Me.flexChart1.AxisY.MajorGrid = False
'Hiding vertical GridLines for AxisX
Me.flexChart1.AxisX.MajorGrid = FalseTick Marks
Tick marks indicate the intervals created by the major and minor axis units. On a categorical axis, tick marks indicate the positions of category values. Minor tick marks do not apply to categorical axes.
By default, FlexChart displays major tick marks outside the X-axis and hides tick marks on the Y-axis.
Use the following properties to configure tick marks:
MajorTickMarks controls the visibility and position of major tick marks.
MinorTickMarks controls the visibility and position of minor tick marks.
TickLength specifies the tick-mark length.
//Setting location for major & minor tick marks for AxisY
this.flexChart1.AxisY.MajorTickMarks = TickMark.Cross;
this.flexChart1.AxisY.MinorTickMarks = TickMark.None;
//Setting location for major & minor tick marks for AxisX
this.flexChart1.AxisX.MajorTickMarks = TickMark.Outside;
this.flexChart1.AxisX.MinorTickMarks = TickMark.None;
'Setting location for major & minor tick marks for AxisY
Me.flexChart1.AxisY.MajorTickMarks = TickMark.Cross
Me.flexChart1.AxisY.MinorTickMarks = TickMark.None
'Setting location for major & minor tick marks for AxisX
Me.flexChart1.AxisX.MajorTickMarks = TickMark.Outside
Me.flexChart1.AxisX.MinorTickMarks = TickMark.None