


Plot Areas
Plot area is the area of chart where data points are plotted. In a chart having X and Y axis, plot area also refers to the area covered by the axes. In a chart like pie chart or sunburst chart, plot area refers to the circular area actually covered by the chart itself.
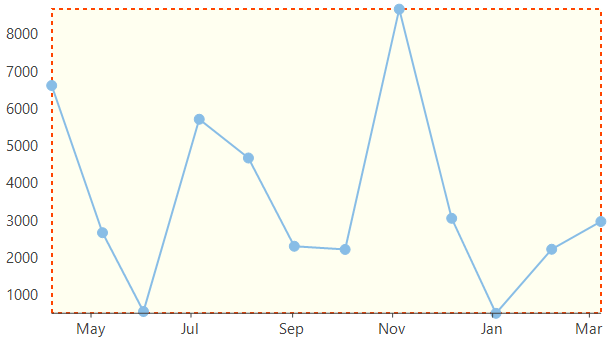
In FlexChart, plot area is rendered with a basic white background color. However, you can customize the appearance of plot area to match your requirements using PlotStyle property of ChartStyle type. The ChartStyle class provides properties to set fill, fill color, line pattern, stroke, stroke width, stroke dash pattern etc.
//Setting color that fills the plot area
this.flexChart1.PlotStyle.Fill = new SolidBrush(Color.Ivory) ;
//Setting brush to be used for stroke pattern
this.flexChart1.PlotStyle.Stroke = Brushes.OrangeRed;
//Setting width to be used for stroke pattern
this.flexChart1.PlotStyle.StrokeWidth = 2.0f;
//Setting pattern to be used stroke
this.flexChart1.PlotStyle.LinePattern = C1.Chart.LinePatternEnum.Dash;
'Setting color that fills the plot area
Me.flexChart1.PlotStyle.Fill = New SolidBrush(Color.LightGray)
'Setting brush to be used for stroke pattern
Me.flexChart1.PlotStyle.Stroke = Brushes.DarkBlue
'Setting width to be used for stroke pattern
Me.flexChart1.PlotStyle.StrokeWidth = 2.0F
'Setting pattern to be used stroke
Me.flexChart1.PlotStyle.LinePattern = C1.Chart.LinePatternEnum.Dash