


Axes
Most chart types plot data between two axes: the horizontal X-axis and the vertical Y-axis. The X-axis typically represents categories, and the Y-axis represents values. For some chart types, such as bar charts, the axes are reversed so that the Y-axis represents categories and the X-axis represents values.
Note: Chart types such as pie, sunburst, and treemap do not use axes.
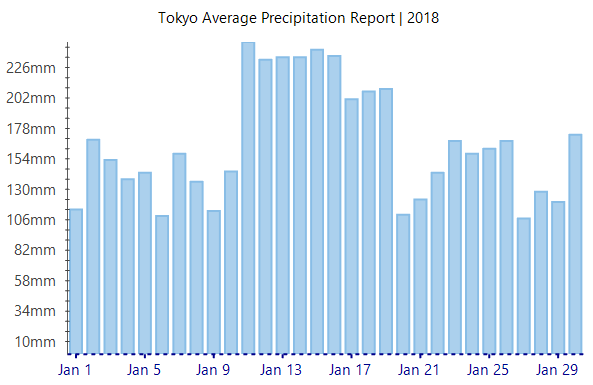
FlexChart exposes the axes through the AxisX and AxisY properties, which return Axis objects. In addition to binding FlexChart to a data source, bind an axis to a separate data source and specify its fields to display custom axis labels.
//Passing data to FlexChart's AxisY
this.flexChart1.AxisY.DataSource = GetAxisBindinglabels();
//Setting which fields to bind to AxisY
this.flexChart1.AxisY.Binding = "Value,Text";
'Passing data to FlexChart's AxisY
Me.flexChart1.AxisY.DataSource = GetAxisBindinglabels()
'Setting which fields to bind to AxisY
Me.flexChart1.AxisY.Binding = "Value,Text"The axis-binding example uses a custom GetAxisBindingLabels method to provide label data. For more information about binding FlexChart, see Data Binding.
Axis Position.
By default, FlexChart displays the X-axis at the bottom of the chart and the Y-axis on the left.
Set the Position property to a value from the Position enumeration to change the location of an axis. Set Position to None to hide the axis.
//Displaying the Y axis on right hand side
      this.flexChart1.AxisY.Position = Position.Right;
' Displaying the Y axis on right hand side
Me.flexChart1.AxisY.Position = Position.Right Display Axis Line
By default, FlexChart displays the X-axis line and hides the Y-axis line.
Set the AxisLine property to true or false to control axis-line visibility.
//Showing axis line for Y-axis, by default it is hidden
      this.flexChart1.AxisY.AxisLine = true;
' Showing axis line for Y-axis, by default it is hidden
me.flexChart1.AxisY.AxisLine = true Reverse Axis
Set the Reversed property to true to display axis values in reverse order. A reversed axis is useful for visualizing data such as depth measurements or descending values.
//Flip the Y-axis to display minimum value on top and maximum towards origin
     this.flexChart1.AxisY.Reversed = true;
' Flip the Y-axis to display minimum value on top and maximum towards origin
me.flexChart1.AxisY.Reversed = true Set Axis Bounds
The Min and Max properties specify the minimum and maximum values displayed on an axis. Setting axis bounds limits the visible data range and focuses the chart on a specific portion of the dataset.
//Setting axis bounds
   this.flexChart1.AxisY.Max = 150;
this.flexChart1.AxisY.Min = 90;
' Setting axis bounds
me.flexChart1.AxisY.Max = 150
me.flexChart1.AxisY.Min = 90 Style an Axis
Use the Axis.Style property to configure the appearance of an axis, including:
Stroke color
Stroke width
Line pattern
Text orientation
//Setting color to be used for stroke
this.flexChart1.AxisX.Style.StrokeColor = Color.DarkBlue;
//Setting width to be used for stroke width
this.flexChart1.AxisX.Style.StrokeWidth = 1;
//Setting pattern to be used line pattern
this.flexChart1.AxisX.Style.LinePattern = LinePatternEnum.DashDot;
'Setting color to be used for stroke
Me.flexChart1.AxisX.Style.StrokeColor = Color.DarkBlue
'Setting width to be used for stroke width
Me.flexChart1.AxisX.Style.StrokeWidth = 1
'Setting pattern to be used line pattern
Me.flexChart1.AxisX.Style.LinePattern = LinePatternEnum.DashDotFlexChart also provides options for configuring axis titles, tick marks, units, gridlines, and labels.
The Axes topic includes the following sections:
Axis Elements — Describes the scale, title, units, gridlines, and tick marks associated with an axis.
Axis Labels — Describes axis-label formatting and options for managing overlapping labels.
Axis Grouping — Describes categorical, numerical, and DateTime axis grouping.