


Multiple Plot Areas
FlexChart supports multiple plot areas for displaying related series in separate chart regions. This layout can improve readability compared to displaying series with different scales in the same plot area.
Each series can be rendered in a separate plot area while sharing chart resources such as axes and legends.
Add plot areas to the PlotAreas collection. Assign a name to each plot area, and use the series or axis PlotAreaName property to specify where the series is rendered.
Configure each plot area through properties such as:
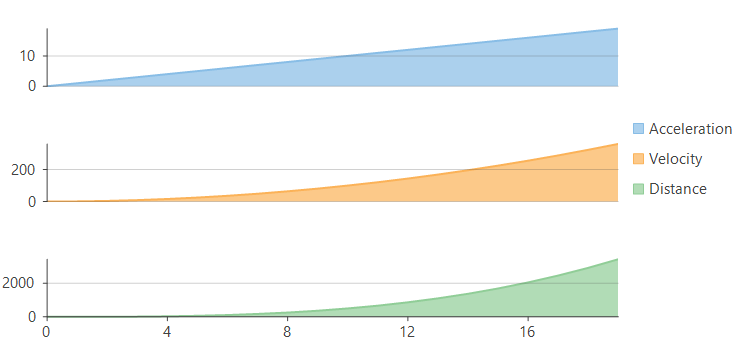
The following chart displays acceleration, velocity, and distance in three separate plot areas over the same time series.
//Add new PlotAreas to FlexChart, Row property decides where to place the PlotArea
flexChart1.PlotAreas.Add(new PlotArea { Name = "plot1", Row = 1 });
flexChart1.PlotAreas.Add(new PlotArea { Name = "plot2", Row = 3 });
flexChart1.PlotAreas.Add(new PlotArea { Name = "plot3", Row = 5 });
//Create new series for Acceleration and set PlotAreaName specifying in which plot to render this series
var acceleration = new Series
{
    Name = "Acceleration",
    DataSource = CreateDataPoints((x) => x, (y) => y, 20),
    AxisY = new Axis {Position = Position.Left, MajorGrid = true, PlotAreaName = "plot1"}
};
this.flexChart1.Series.Add(acceleration);
//Create new series for Velocity and set PlotAreaName specifying in which plot to render this series
var velocity = new Series
{
    Name = "Velocity",
    DataSource = CreateDataPoints((x) => x, (y) => y * y, 20),
    AxisY = new Axis {Position = Position.Left, MajorGrid = true, PlotAreaName = "plot2"}
};
this.flexChart1.Series.Add(velocity);
//Create new series for distance and set PlotAreaName specifying in which plot to render this series
var distance = new Series
{
    Name = "Distance",
    DataSource = CreateDataPoints((x) => x, (y) => 0.5 * y * y * y, 20),
    AxisY = new Axis {Position = Position.Left, MajorGrid = true, PlotAreaName = "plot3"}
};
this.flexChart1.Series.Add(distance);
'Add new PlotAreas to FlexChart, Row property decides where to place the PlotArea
flexChart1.PlotAreas.Add(New PlotArea() With {
.Name = "plot1",
.Row = 1
})
flexChart1.PlotAreas.Add(New PlotArea() With {
.Name = "plot2",
.Row = 3
})
flexChart1.PlotAreas.Add(New PlotArea() With {
.Name = "plot3",
.Row = 5
})
'Create new series for Acceleration and set PlotAreaName specifying in which plot to render this series
Dim acceleration As Series = New Series() With {
.Name = "Acceleration",
.DataSource = CreateDataPoints(Function(x) x, Function(y) y, 20),
.AxisY = New Axis() With {
.Position = Position.Left,
.MajorGrid = True,
.PlotAreaName = "plot1"
}
}
Me.flexChart1.Series.Add(acceleration)
'Create new series for Velocity and set PlotAreaName specifying in which plot to render this series
Dim velocity As Series = New Series() With {
.Name = "Velocity",
.DataSource = CreateDataPoints(Function(x) x, Function(y) y * y, 20),
.AxisY = New Axis() With {
.Position = Position.Left,
.MajorGrid = True,
.PlotAreaName = "plot2"
}
}
Me.flexChart1.Series.Add(velocity)
'Create new series for distance and set PlotAreaName specifying in which plot to render this series
Dim distance As Series = New Series() With {
.Name = "Distance",
.DataSource = CreateDataPoints(Function(x) x, Function(y) 0.5 * y * y * y, 20),
.AxisY = New Axis() With {
.Position = Position.Left,
.MajorGrid = True,
.PlotAreaName = "plot3"
}
}
Me.flexChart1.Series.Add(distance)Note: The example uses a custom CreateDataPoints method to generate sample data. Replace this method with a data source appropriate for the applicatio
// Method for creating data for FlexChart
public static List<PointD> CreateDataPoints(Func<double, double> funX, Func<double, double> funY, int count)
{
    var data = new List<PointD>();
    for (int i = 0; i < count; i++)
    {
        data.Add(new PointD
        {
            X = funX(i),
            Y = funY(i),
        });
    }
    return data;
}
' Method for creating data for FlexChart
Public Shared Function CreateDataPoints(funX As Func(Of Double, Double), funY As Func(Of Double, Double), count As Integer) As List(Of PointD)
Dim data As List(Of PointD) = New List(Of PointD)()
For i As Integer = 0 To count - 1
data.Add(New PointD() With {
.X = funX(i),
.Y = funY(i)
})
Next
Return data
End Function