- 2D Chart for WinForms Overview
- Key Features
- Chart for WinForms Quick Start
- Design-Time Support
- Chart Fundamentals
- Common Usage for Basic 2D Charts
- Specific 2D Charts
- Design-Time Tools for Creating 2D Charts
- Charting Data
- Data Binding
- Charting Labels
- Chart Area and Plot Area Objects
- Customizing Chart Elements
- Loading and Saving Charts, Data, and Images
- End-User Interaction
- Chart for WinForms Samples
- Chart for WinForms Tutorials
- Chart for WinForms Task-Based Help
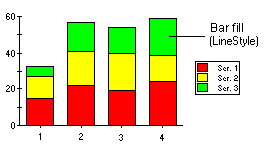
Stacking Bar Charts
A Stacking Bar chart draws each series as a portion of a stacked bar cluster, the number of clusters being the number of points in the data. Each bar displays the nth data point in each series. Cylinder, Pyramid, and Cone Bar charts can also be stacked by setting the Stacked property to True. Using the LineStyle, the fill properties of each series can be customized. For more information, see Line and Symbol Styles for the Series.
Code Example
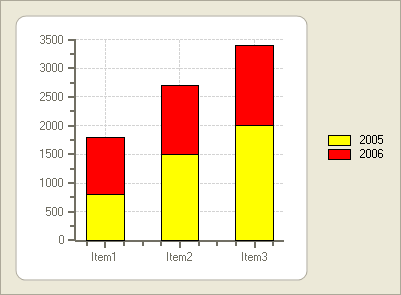
The following example creates a Stacked Bar chart. Just add the C1Chart control to your Visual Studio project, and add the following code to see a running example of the Stacked Bar chart:
To write code in Visual Basic
Private Sub Form1_Load(ByVal sender As System.Object, ByVal e As System.EventArgs) Handles MyBase.Load
        ' Clear previous data
                C1Chart1.ChartGroups(0).ChartData.SeriesList.Clear()
        ' Data
                Dim items As String() = New String() {"Item1", "Item2", "Item3"}
        Dim sales2005 As Integer() = New Integer() {800, 1500, 2000}
        Dim sales2006 As Integer() = New Integer() {1000, 1200, 1400}
        ' Create first series
                Dim ds2005 As C1.Win.C1Chart.ChartDataSeries =
        C1Chart1.ChartGroups(0).ChartData.SeriesList.AddNewSeries()
        ds2005.Label = "2005"
        ds2005.LineStyle.Color = Color.Yellow
        ds2005.X.CopyDataIn(items)
        ds2005.Y.CopyDataIn(sales2005)
        ' Create second series
                Dim ds2006 As C1.Win.C1Chart.ChartDataSeries =
        C1Chart1.ChartGroups(0).ChartData.SeriesList.AddNewSeries()
        ds2006.Label = "2006"
        ds2006.LineStyle.Color = Color.Red
        ds2006.AutoEnumerate = True
        ds2006.Y.CopyDataIn(sales2006)
        ' Set chart type
                C1Chart1.ChartGroups(0).ChartType = C1.Win.C1Chart.Chart2DTypeEnum.Bar
        C1Chart1.ChartGroups(0).Stacked = True
        ' Set y-axis minimum
                C1Chart1.ChartArea.AxisY.Min = 0
        C1Chart1.Legend.Visible = True
        ' Remove the Axes caption
                C1Chart1.ChartArea.AxisX.Text = ""
        C1Chart1.ChartArea.AxisY.Text = ""
End Sub
To write code in C#
private void Form1_Load(object sender, EventArgs e)
{
        // Clear previous data
                c1Chart1.ChartGroups[0].ChartData.SeriesList.Clear();
        // Data
                string[] items = new string[] { "Item1", "Item2", "Item3"};
        int[] sales2005 = new int[] { 800, 1500, 2000};
        int[] sales2006 = new int[] { 1000, 1200, 1400};
        // Create first series
                C1.Win.C1Chart.ChartDataSeries ds2005 =
        c1Chart1.ChartGroups[0].ChartData.SeriesList.AddNewSeries();
        ds2005.Label = "2005";
        ds2005.LineStyle.Color = Color.Yellow;
        ds2005.X.CopyDataIn( items);
        ds2005.Y.CopyDataIn( sales2005);
        // Create second series
                C1.Win.C1Chart.ChartDataSeries ds2006 =
        c1Chart1.ChartGroups[0].ChartData.SeriesList.AddNewSeries();
        ds2006.Label = "2006";
        ds2006.LineStyle.Color = Color.Red;
        ds2006.AutoEnumerate = true;
        ds2006.Y.CopyDataIn( sales2006);
        // Set chart type
                c1Chart1.ChartGroups[0].ChartType = C1.Win.C1Chart.Chart2DTypeEnum.Bar;
        c1Chart1.ChartGroups[0].Stacked = true;
        // Set y-axis minimum
                c1Chart1.ChartArea.AxisY.Min = 0;
        c1Chart1.Legend.Visible = true;
        // Remove the Axes caption
                c1Chart1.ChartArea.AxisX.Text = "";
        c1Chart1.ChartArea.AxisY.Text = "";
}
The code example above produces the following chart: