
- 2D Chart for WinForms Overview
- Key Features
- Chart for WinForms Quick Start
- Design-Time Support
- Chart Fundamentals
- Common Usage for Basic 2D Charts
- Specific 2D Charts
- Design-Time Tools for Creating 2D Charts
- Charting Data
- Data Binding
- Charting Labels
- Chart Area and Plot Area Objects
- Customizing Chart Elements
- Loading and Saving Charts, Data, and Images
- End-User Interaction
- Chart for WinForms Samples
- Chart for WinForms Tutorials
- Chart for WinForms Task-Based Help
Axis Annotation Location
The location can be set for the axis annotations by choosing one of the following values in the TickLabelsEnum enumeration.
| Value | Description |
|---|---|
| TickLabelsEnum.None | No annotations along the axis. |
| TickLabelsEnum.High | Annotations are drawn near the maximum value of the perpendicular axis, and inside the plot area. For X-Axis annotation, if data is not available for Group0 and is available for Group1, the Y2 axis determines the location, otherwise the Y axis is used. Annotations which overlap the crossing axis are eliminated. |
| TickLabelsEnum.Low | Annotations are drawn near the minimum value of the perpendicular axis, and inside the plot area. For X axis annotations, if the data is not available for Group0 and is available for Group1, the Y2 axis determines the location, otherwise the Y axis is used. Annotations which overlap the crossing axis are eliminated. |
| TickLabelsEnum.NextToAxis | Annotations are drawn next to the axis. This is the default value. |
High and Low specify that maximum and minimum positions of the cross axis. For example, if High is specified for the X axis TickLabelEnum, then the annotations are placed near the Maximum value of the Y axis, which is not necessarily the top of the chart (Reversed = true).
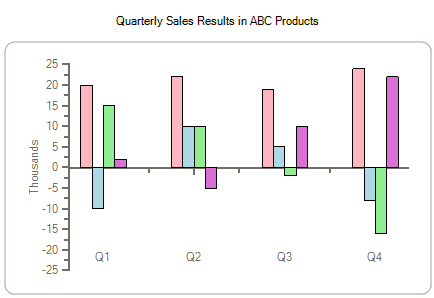
The High or Low values are typically used if you have values below the Axis-Y origin. In the following example, specifying AxisX.TickLabels = TickLabelsEnum.Low has placed them near the -25 value of the Y axis.
To programmatically set the value for the TickLabelsEnum:
To write code in Visual Basic
Dim ax As Axis =c1Chart1.ChartArea.AxisX
ax.TickLabels = TickLabelsEnum.Low
To write code in C#
Axis ax = c1Chart1.ChartArea.AxisX;
Ax.TickLabels = TickLabelsEnum.Low;