- Getting Started
-
Topics
- Wijmo
-
Chart
- Basic
-
Advanced
- Animation
- Annotations
- Conditional Formatting
- Data Labels
- Export
- Grouping and Drilldown
- Hit-Testing
- Interpolating Nulls
- Legend and Titles
- Line Markers
- Plot Areas
- Range Selectors
- Selection
- Sorting & Filtering
- Styling Series
- Toggle Series Visibility
- Tooltips
- Zooming
- SpecialCharts
- Axes
- Financial
- Analytics
- Map
- Cloud
- Gauge
- Grid
- OLAP
- Input
- Nav
- Viewer
- Tutorials
Financial Overlays in FinancialChart
The wijmo.chart.finance.analytics module contains the analytical extensions for FinancialChart including technical indicators, overlays and Fibonacci tools.
Overlays, like technical indicators, are a set of derived data that is calculated by applying one or more formulas to the original set of data. Overlays are generally used to forecast an asset's market direction and generally plotted with the original data set since the the Y-axis scales are the same.
FinancialChart supports two analytical overlays: Bollinger Bands® and Envelopes. For generic overlays, such as text annotations, see the Advanced Concepts/Annotations topic.
The analytical overlays extend the regular Series class to provide a calculated series based on the data and parameters you select.
To add analytical overlays to a chart, follow these steps:
- Create one or more overlay objects (bands or envelopes),
- Configure the indicator as you would a regular series, setting their binding, bindingX, and style properties for example, and
- Set the overlay's period or size properties to determine the parameters for the calculation. Some overlays have more than one parameter.
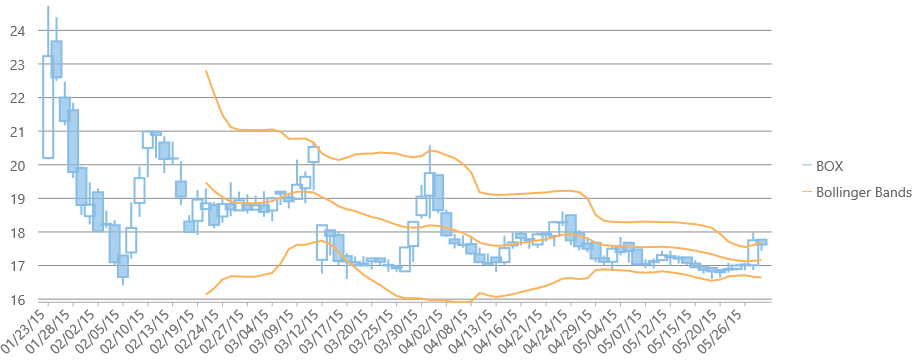
Bollinger Bands
A Bollinger Band is a set of lines plotted two standard deviations (positively and negatively) away from a simple moving average of the price. Bollinger Bands is a registered trademark of John Bollinger.
Example:
import * as chart from '@mescius/wijmo.chart';
import * as fChart from '@mescius/wijmo.chart.finance';
import * as fChartAnalytics from '@mescius/wijmo.chart.finance.analytics';

var myFinancialChart = new fChart.FinancialChart('#myFinancialChart');
myFinancialChart.bindingX = 'date';
myFinancialChart.chartType = 'Candlestick';

// create candlestick data series
var series1 = new chart.Series();
series1.binding = 'high,low,open,close';
myFinancialChart.series.push(series1);

// create Bollinger bands
var bb = new fChartAnalytics.BollingerBands();
bb.binding = 'close';
bb.style = { stroke: 'yellow', strokeWidth: 2 };
bb.name = 'Bollinger Bands'; // name in legend
bb.period = 20;
bb.multiplier = 2;
bb.visibility = 'Visible';
myFinancialChart.series.push(bb);
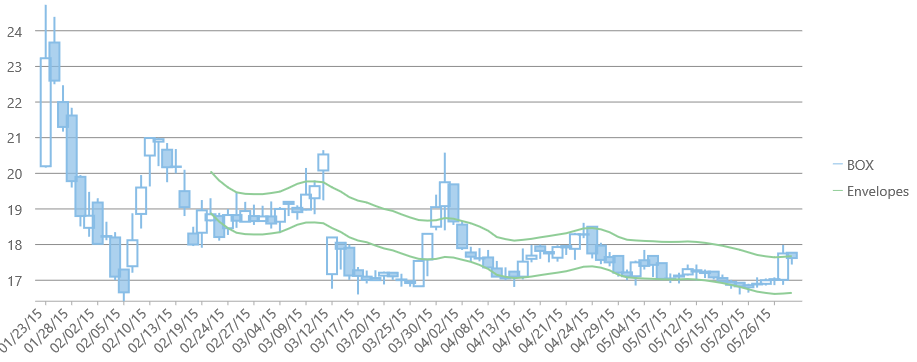
Envelopes
Moving average envelopes are moving averages set above and below a standard moving average. The amount above/below the standard moving average is percentage based and dictated by the size property. The type of moving average is dictated by the type property.
Supported moving average types:
- Simple: An average of the last n values.
- Weighted: Weighted average of the last n values, where the weight decreases by 1 with each previous value.
- Exponential: Weighted average of the last n values, where the weight decreases exponentially with each previous value.
- Triangular: Weighted average of the last n values, whose result is equivalent to a double smoothed simple moving average.
Example:
var myFinancialChart = new fChart.FinancialChart('#myFinancialChart');
myFinancialChart.bindingX = 'date';
myFinancialChart.chartType = 'Candlestick';

// create candlestick data series
var series1 = new chart.Series();
series1.binding = 'high,low,open,close';
myFinancialChart.series.push(series1);

// create Bollinger bands
var env = new fChartAnalytics.Envelopes();
env.binding = 'close';
env.style = { stroke: 'yellow', strokeWidth: 2 };
env.name = 'Envelopes'; // name in legend
env.type = 'Simple';
env.period = 20;
env.size = 0.3;
env.visibility = 'Visible';
myFinancialChart.series.push(env);