
-
Spread Windows Forms Product Documentation
- Getting Started
-
Developer's Guide
- Understanding the Product
- Working with the Component
- Spreadsheet Objects
- Ribbon Control
- Sheets
- Rows and Columns
- Headers
- Cells
- Cell Types
- Data Binding
- Customizing the Sheet Appearance
- Customizing Interaction in Cells
- Tables
- Pivot Table
- Understanding the Underlying Models
- Customizing Row or Column Interaction
- Formulas in Cells
- Sparklines
- Keyboard Interaction
- Events from User Actions
- File Operations
- Storing Excel Summary and View
- Printing
- Chart Control
- Enhanced Chart
- Customizing Drawing
- Touch Support with the Component
- Spread Designer Guide
- Assembly Reference
- Import and Export Reference
- Version Comparison Reference
Setting Pivot Table Styles
Spread WinForms allows users to apply built-in or custom styles to pivot tables. By default, a built-in style is automatically applied when a pivot table is added to a worksheet. You can also modify the pivot table style by duplicating an existing style or creating a custom style from scratch.
Apply Built-In Pivot Table Style
You can change the default appearance of the pivot table by applying any of the built-in styles. In order to apply built-in style to the pivot table, users can use the TableStyle property of the IPivotTable interface.
The image shared below depicts a pivot table with built-in style.
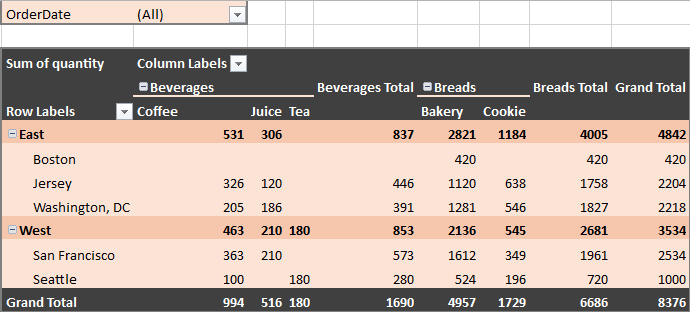
Refer to the following example code to apply built-in style to the pivot table.
C#
fpSpread1.BorderCollapse = BorderCollapse.Enhanced;
IWorkbook workbook = fpSpread1.AsWorkbook();
IWorksheet sheet1 = workbook.ActiveSheet;

// Set data.
sheet1.SetValue(0, 0, new object[,]
{
    { "OrderDate", "Region", "City", "Category", "Product", "Quantity" },
    { "2025-07-01", "East", "Jersey", "Breads", "Bakery", 1120 },
    { "2025-07-01", "East", "Jersey", "Breads", "Cookie", 563 },
    { "2025-07-02", "East", "Washington, DC", "Breads", "Bakery", 1281 },
    { "2025-07-02", "East", "Washington, DC", "Breads", "Cookie", 546 },
    { "2025-07-01", "East", "Jersey", "Beverages", "Coffee", 326 },
    { "2025-07-02", "East", "Washington, DC", "Beverages", "Coffee", 205 },
    { "2025-07-02", "East", "Washington, DC", "Beverages", "Juice", 186 },
    { "2025-07-01", "West", "San Francisco", "Breads", "Bakery", 1262 },
    { "2025-07-01", "West", "San Francisco", "Breads", "Cookie", 349 },
    { "2025-07-01", "West", "Seattle", "Breads", "Bakery", 524 },
    { "2025-07-01", "West", "Seattle", "Breads", "Cookie", 196 },
    { "2025-07-01", "West", "San Francisco", "Beverages", "Coffee", 363 },
    { "2025-07-01", "West", "Seattle", "Beverages", "Coffee", 100 },
    { "2025-07-02", "East", "Jersey", "Beverages", "Juice",  120 },
    { "2025-07-02", "West", "San Francisco", "Breads", "Bakery", 350 },
    { "2025-07-02", "West", "Seattle", "Beverages", "Tea", 180 },
    { "2025-07-02", "East", "Jersey", "Breads", "Cookie", 75 },
    { "2025-07-03", "West", "San Francisco", "Beverages", "Juice", 210 },
    { "2025-07-03", "East", "Boston", "Breads", "Bakery", 420 },
});

IPivotCache pvCache = fpSpread1.AsWorkbook().PivotCaches.Create("Sheet1!A1:F20");
IPivotTable pvTable = pvCache.CreatePivotTable(sheet1.Cells["I1"]);
IPivotFields pvFields = pvTable.PivotFields;

pvTable.AddDataField(pvFields["Quantity"], "Sum of quantity", ConsolidationFunction.Sum);
pvFields["Region"].Orientation = PivotFieldOrientation.Row;
pvFields["City"].Orientation = PivotFieldOrientation.Row;
pvFields["Category"].Orientation = PivotFieldOrientation.Column;
pvFields["Product"].Orientation = PivotFieldOrientation.Column;
pvFields["OrderDate"].Orientation = PivotFieldOrientation.Page;

// Set a built-in style for the PivotTable.
ITableStyle tbStyle1 = fpSpread1.AsWorkbook().TableStyles[BuiltInPivotStyles.PivotStyleDark10];
pvTable.TableStyle = tbStyle1;
VB
fpSpread1.BorderCollapse = BorderCollapse.Enhanced
Dim workbook As IWorkbook = fpSpread1.AsWorkbook()
Dim sheet1 As IWorksheet = workbook.ActiveSheet

' Set data.
sheet1.SetValue(0, 0, New Object(,) {
    { "OrderDate", "Region", "City", "Category", "Product", "Quantity" },
    { "2025-07-01", "East", "Jersey", "Breads", "Bakery", 1120 },
    { "2025-07-01", "East", "Jersey", "Breads", "Cookie", 563 },
    { "2025-07-02", "East", "Washington, DC", "Breads", "Bakery", 1281 },
    { "2025-07-02", "East", "Washington, DC", "Breads", "Cookie", 546 },
    { "2025-07-01", "East", "Jersey", "Beverages", "Coffee", 326 },
    { "2025-07-02", "East", "Washington, DC", "Beverages", "Coffee", 205 },
    { "2025-07-02", "East", "Washington, DC", "Beverages", "Juice", 186 },
    { "2025-07-01", "West", "San Francisco", "Breads", "Bakery", 1262 },
    { "2025-07-01", "West", "San Francisco", "Breads", "Cookie", 349 },
    { "2025-07-01", "West", "Seattle", "Breads", "Bakery", 524 },
    { "2025-07-01", "West", "Seattle", "Breads", "Cookie", 196 },
    { "2025-07-01", "West", "San Francisco", "Beverages", "Coffee", 363 },
    { "2025-07-01", "West", "Seattle", "Beverages", "Coffee", 100 },
    { "2025-07-02", "East", "Jersey", "Beverages", "Juice",  120 },
    { "2025-07-02", "West", "San Francisco", "Breads", "Bakery", 350 },
    { "2025-07-02", "West", "Seattle", "Beverages", "Tea", 180 },
    { "2025-07-02", "East", "Jersey", "Breads", "Cookie", 75 },
    { "2025-07-03", "West", "San Francisco", "Beverages", "Juice", 210 },
    { "2025-07-03", "East", "Boston", "Breads", "Bakery", 420 }
})

Dim pvCache As IPivotCache = fpSpread1.AsWorkbook().PivotCaches.Create("Sheet1!A1:F20")
Dim pvTable As IPivotTable = pvCache.CreatePivotTable(sheet1.Cells("I1"))
Dim pvFields As IPivotFields = pvTable.PivotFields

pvTable.AddDataField(pvFields("Quantity"), "Sum of quantity", ConsolidationFunction.Sum)
pvFields("Region").Orientation = PivotFieldOrientation.Row
pvFields("City").Orientation = PivotFieldOrientation.Row
pvFields("Category").Orientation = PivotFieldOrientation.Column
pvFields("Product").Orientation = PivotFieldOrientation.Column
pvFields("OrderDate").Orientation = PivotFieldOrientation.Page

' Set a built-in style for the PivotTable.
Dim tbStyle1 As ITableStyle = fpSpread1.AsWorkbook().TableStyles(BuiltInPivotStyles.PivotStyleDark10)
pvTable.TableStyle = tbStyle1
Apply Custom Style
If you don't want to apply any of the built-in styles, you can also create and apply your own custom style to the pivot table. This can be done using the TableStyle property of the IPivotTable interface.
The image shared below depicts a pivot table with custom style.
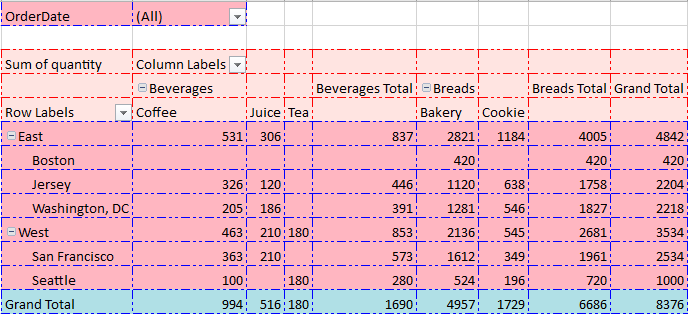
Refer to the following example code to apply custom style to the pivot table.
C#
fpSpread1.BorderCollapse = BorderCollapse.Enhanced;
IWorkbook workbook = fpSpread1.AsWorkbook();
IWorksheet sheet1 = workbook.ActiveSheet;

// Set data.
sheet1.SetValue(0, 0, new object[,] {
      { "OrderDate", "Region", "City", "Category", "Product", "Quantity" },
      { "2025-07-01", "East", "Jersey", "Breads", "Bakery", 1120 },
      { "2025-07-01", "East", "Jersey", "Breads", "Cookie", 563 },
      { "2025-07-02", "East", "Washington, DC", "Breads", "Bakery", 1281 },
      { "2025-07-02", "East", "Washington, DC", "Breads", "Cookie", 546 },
      { "2025-07-01", "East", "Jersey", "Beverages", "Coffee", 326 },
      { "2025-07-02", "East", "Washington, DC", "Beverages", "Coffee", 205 },
      { "2025-07-02", "East", "Washington, DC", "Beverages", "Juice", 186 },
      { "2025-07-01", "West", "San Francisco", "Breads", "Bakery", 1262 },
      { "2025-07-01", "West", "San Francisco", "Breads", "Cookie", 349 },
      { "2025-07-01", "West", "Seattle", "Breads", "Bakery", 524 },
      { "2025-07-01", "West", "Seattle", "Breads", "Cookie", 196 },
      { "2025-07-01", "West", "San Francisco", "Beverages", "Coffee", 363 },
      { "2025-07-01", "West", "Seattle", "Beverages", "Coffee", 100 },
      { "2025-07-02", "East", "Jersey", "Beverages", "Juice",  120 },
      { "2025-07-02", "West", "San Francisco", "Breads", "Bakery", 350 },
      { "2025-07-02", "West", "Seattle", "Beverages", "Tea", 180 },
      { "2025-07-02", "East", "Jersey", "Breads", "Cookie", 75 },
      { "2025-07-03", "West", "San Francisco", "Beverages", "Juice", 210 },
      { "2025-07-03", "East", "Boston", "Breads", "Bakery", 420 },
});

IPivotCache pvCache = fpSpread1.AsWorkbook().PivotCaches.Create("Sheet1!A1:F20");
IPivotTable pvTable = pvCache.CreatePivotTable(sheet1.Cells["I1"]);
IPivotFields pvFields = pvTable.PivotFields;

pvTable.AddDataField(pvFields["Quantity"], "Sum of quantity", ConsolidationFunction.Sum);
pvFields["Region"].Orientation = PivotFieldOrientation.Row;
pvFields["City"].Orientation = PivotFieldOrientation.Row;
pvFields["Category"].Orientation = PivotFieldOrientation.Column;
pvFields["Product"].Orientation = PivotFieldOrientation.Column;
pvFields["OrderDate"].Orientation = PivotFieldOrientation.Page;

// Create a custom table style.
ITableStyle tbStyle = fpSpread1.AsWorkbook().TableStyles.Add("Style1");

// Set background colors.
tbStyle[TableStyleElementType.HeaderRow].Interior.Color = GrapeCity.Spreadsheet.Color.FromArgb(255, 255, 228, 225);
tbStyle[TableStyleElementType.TotalRow].Interior.Color = GrapeCity.Spreadsheet.Color.FromArgb(255, 176, 224, 230);
tbStyle[TableStyleElementType.WholeTable].Interior.Color = GrapeCity.Spreadsheet.Color.FromArgb(255, 255, 182, 193);

// Set blue dashed borders for the whole table.
GrapeCity.Spreadsheet.Border lineBorder = GrapeCity.Spreadsheet.Border.NoBorder;
GrapeCity.Spreadsheet.BorderLine thinBlueSideBorder = new GrapeCity.Spreadsheet.BorderLine(
    GrapeCity.Spreadsheet.BorderLineStyle.DashDotDot,
    GrapeCity.Spreadsheet.Color.FromKnownColor(GrapeCity.Core.KnownColor.Blue)
);
lineBorder.All = thinBlueSideBorder;
tbStyle[TableStyleElementType.WholeTable].Borders.ApplyBorder(lineBorder);

// Set red dashed borders for the header row.
GrapeCity.Spreadsheet.Border lineBorder1 = GrapeCity.Spreadsheet.Border.NoBorder;
GrapeCity.Spreadsheet.BorderLine thinBlueSideBorder1 = new GrapeCity.Spreadsheet.BorderLine(
    GrapeCity.Spreadsheet.BorderLineStyle.DashDotDot,
    GrapeCity.Spreadsheet.Color.FromKnownColor(GrapeCity.Core.KnownColor.Red)
);
lineBorder1.All = thinBlueSideBorder1;
tbStyle[TableStyleElementType.HeaderRow].Borders.ApplyBorder(lineBorder1);

// Apply the custom style to the pivot table.
pvTable.TableStyle = tbStyle;
VB
fpSpread1.BorderCollapse = BorderCollapse.Enhanced ' Enable enhanced border rendering
Dim workbook As IWorkbook = fpSpread1.AsWorkbook()
Dim sheet1 As IWorksheet = workbook.ActiveSheet

' Set data.
sheet1.SetValue(0, 0, New Object(,) {
    {"OrderDate", "Region", "City", "Category", "Product", "Quantity"},
    {"2025-07-01", "East", "Jersey", "Breads", "Bakery", 1120},
    {"2025-07-01", "East", "Jersey", "Breads", "Cookie", 563},
    {"2025-07-02", "East", "Washington, DC", "Breads", "Bakery", 1281},
    {"2025-07-02", "East", "Washington, DC", "Breads", "Cookie", 546},
    {"2025-07-01", "East", "Jersey", "Beverages", "Coffee", 326},
    {"2025-07-02", "East", "Washington, DC", "Beverages", "Coffee", 205},
    {"2025-07-02", "East", "Washington, DC", "Beverages", "Juice", 186},
    {"2025-07-01", "West", "San Francisco", "Breads", "Bakery", 1262},
    {"2025-07-01", "West", "San Francisco", "Breads", "Cookie", 349},
    {"2025-07-01", "West", "Seattle", "Breads", "Bakery", 524},
    {"2025-07-01", "West", "Seattle", "Breads", "Cookie", 196},
    {"2025-07-01", "West", "San Francisco", "Beverages", "Coffee", 363},
    {"2025-07-01", "West", "Seattle", "Beverages", "Coffee", 100},
    {"2025-07-02", "East", "Jersey", "Beverages", "Juice", 120},
    {"2025-07-02", "West", "San Francisco", "Breads", "Bakery", 350},
    {"2025-07-02", "West", "Seattle", "Beverages", "Tea", 180},
    {"2025-07-02", "East", "Jersey", "Breads", "Cookie", 75},
    {"2025-07-03", "West", "San Francisco", "Beverages", "Juice", 210},
    {"2025-07-03", "East", "Boston", "Breads", "Bakery", 420}
})

' Create PivotCache and PivotTable.
Dim pvCache As IPivotCache = fpSpread1.AsWorkbook().PivotCaches.Create("Sheet1!A1:F20")
Dim pvTable As IPivotTable = pvCache.CreatePivotTable(sheet1.Cells("I1"))
Dim pvFields As IPivotFields = pvTable.PivotFields

' Configure PivotTable fields.
pvTable.AddDataField(pvFields("Quantity"), "Sum of quantity", ConsolidationFunction.Sum)
pvFields("Region").Orientation = PivotFieldOrientation.Row
pvFields("City").Orientation = PivotFieldOrientation.Row
pvFields("Category").Orientation = PivotFieldOrientation.Column
pvFields("Product").Orientation = PivotFieldOrientation.Column
pvFields("OrderDate").Orientation = PivotFieldOrientation.Page

' Create a custom table style.
Dim tbStyle As ITableStyle = fpSpread1.AsWorkbook().TableStyles.Add("Style1")

' Set background colors.
tbStyle(TableStyleElementType.HeaderRow).Interior.Color = GrapeCity.Spreadsheet.Color.FromArgb(255, 255, 228, 225)
tbStyle(TableStyleElementType.TotalRow).Interior.Color = GrapeCity.Spreadsheet.Color.FromArgb(255, 176, 224, 230)
tbStyle(TableStyleElementType.WholeTable).Interior.Color = GrapeCity.Spreadsheet.Color.FromArgb(255, 255, 182, 193)

' Set blue dashed borders for the whole table.
Dim lineBorder As GrapeCity.Spreadsheet.Border = GrapeCity.Spreadsheet.Border.NoBorder
Dim thinBlueSideBorder As New GrapeCity.Spreadsheet.BorderLine(
    GrapeCity.Spreadsheet.BorderLineStyle.DashDotDot,
    GrapeCity.Spreadsheet.Color.FromKnownColor(GrapeCity.Core.KnownColor.Blue)
)
lineBorder.All = thinBlueSideBorder
tbStyle(TableStyleElementType.WholeTable).Borders.ApplyBorder(lineBorder)

' Set red dashed borders for the header row.
Dim lineBorder1 As GrapeCity.Spreadsheet.Border = GrapeCity.Spreadsheet.Border.NoBorder
Dim thinBlueSideBorder1 As New GrapeCity.Spreadsheet.BorderLine(
    GrapeCity.Spreadsheet.BorderLineStyle.DashDotDot,
    GrapeCity.Spreadsheet.Color.FromKnownColor(GrapeCity.Core.KnownColor.Red)
)
lineBorder1.All = thinBlueSideBorder1
tbStyle(TableStyleElementType.HeaderRow).Borders.ApplyBorder(lineBorder1)

' Apply the custom style to the pivot table.
pvTable.TableStyle = tbStyle
Style Compatibility Explanation
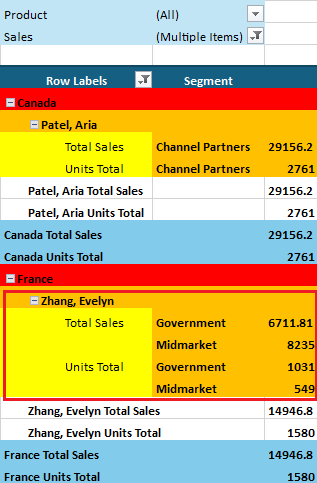
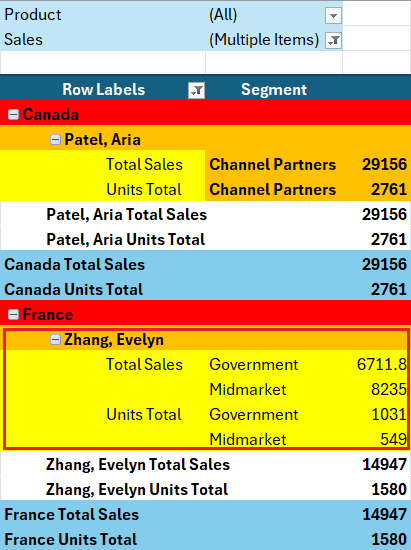
By default, Spread WinForms maintains consistency with MsExcel in pivot table style behavior, such as the application rules for row header styles. To address some of MsExcel’s complex and hard-to-understand composite policies when handling pivot table styles, Spread WinForms provides the Compatibility.PivotTable option for optimization. When this option is turned off, Spread WinForms will optimize the related styles, and its display and behavior may differ from MsExcel. For specific differences, please refer to the table below.
Spread WinForms | MsExcel |
|---|---|
|
|
Refer to the following example code to set Spread WinForms to be incompatible with MsExcel pivot table styles.
C#
GrapeCity.Spreadsheet.WorkbookSet.Compatibility &= ~Compatibility.PivotTable;VB
GrapeCity.Spreadsheet.WorkbookSet.Compatibility = GrapeCity.Spreadsheet.WorkbookSet.Compatibility And Not Compatibility.PivotTable