
-
Spread Windows Forms Product Documentation
- Getting Started
-
Developer's Guide
- Understanding the Product
- Working with the Component
- Spreadsheet Objects
- Ribbon Control
- Sheets
- Rows and Columns
- Headers
- Cells
- Cell Types
- Data Binding
- Customizing the Sheet Appearance
- Customizing Interaction in Cells
- Tables
- Pivot Table
- Understanding the Underlying Models
- Customizing Row or Column Interaction
- Formulas in Cells
- Sparklines
- Keyboard Interaction
- Events from User Actions
- File Operations
- Storing Excel Summary and View
- Printing
- Chart Control
- Enhanced Chart
- Customizing Drawing
- Touch Support with the Component
- Spread Designer Guide
- Assembly Reference
- Import and Export Reference
- Version Comparison Reference
Configuring Pivot Table Fields
Pivot Table fields can be divided into three main types:
Pivot Table Fields – Directly from the original data, used for basic grouping and summarizing.
Grouped Pivot Table Fields – Formed by grouping values from existing fields, such as by ranges or categories.
Calculated Pivot Table Fields – Created using custom formulas within the pivot table for advanced calculations.
Pivot Table Fields
Fields | Description |
|---|---|
Row Fields | Each item in the row field creates a new row, allowing you to group and summarize data by these values. |
Column Fields | Each item in the column field creates a new column, allowing you to compare data side by side. |
Data Fields | Data Fields are used to summarize numeric data, typically by using functions such as Sum, Count, Average, Min, or Max. These fields are placed in the Values area, and the pivot table aggregates the data according to your chosen function. |
Filter Fields | Filter fields allow you to filter the entire pivot table based on the values you select. |
The following code sample shows how to assign fields to the Row, Column, Values, and Filter areas of a pivot table.
C#
IPivotCache pvCache = workbook.PivotCaches.Create("ProductData!A1:F20");
IPivotTable pvTable = pvCache.CreatePivotTable(sheet1.Cells["I1"]);
IPivotFields pvFields = pvTable.PivotFields;

// Assign fields to the Row, Column, Data, and Filter areas of the pivot table.
pvFields["Product"].Orientation = PivotFieldOrientation.Row;
pvFields["Region"].Orientation = PivotFieldOrientation.Column;
pvFields["Amount"].Orientation = PivotFieldOrientation.Data;
pvFields["Order ID"].Orientation = PivotFieldOrientation.Page;
VB
Dim pvCache As IPivotCache = workbook.PivotCaches.Create("ProductData!A1:F20")
Dim pvTable As IPivotTable = pvCache.CreatePivotTable(sheet1.Cells("I1"))
Dim pvFields As IPivotFields = pvTable.PivotFields

' Assign fields to the Row, Column, Data, and Filter areas of the pivot table.
pvFields("Product").Orientation = PivotFieldOrientation.Row
pvFields("Region").Orientation = PivotFieldOrientation.Column
pvFields("Amount").Orientation = PivotFieldOrientation.Data
pvFields("Order ID").Orientation = PivotFieldOrientation.Page
Summarize Values By
By default, pivot table use a default function based on data of the pivot field. To analyze alternative summary values, you can change the summary function of a field by setting the Function property.
The following code demonstrates how to set the summary function of the "Amount" field to Average.
C#
pvFields["Amount"].Function = ConsolidationFunction.Average;VB
pvFields("Amount").Function = ConsolidationFunction.AverageManage Pivot Field Position
The following code demonstrates how to manage the field position of a pivot table.
C#
// Category in Position 1.
pvFields["Category"].Orientation = PivotFieldOrientation.Row;

// Product in Position 2.
pvFields["Product"].Orientation = PivotFieldOrientation.Row;

pvFields["Amount"].Orientation = PivotFieldOrientation.Data;

// Product will in Position 1 and Category in Position 2.
pvFields["Category"].Position = 1;
pvFields["Product"].Position = 0;
VB
' Category in Position 1.
pvFields("Category").Orientation = PivotFieldOrientation.Row

' Product in Position 2.
pvFields("Product").Orientation = PivotFieldOrientation.Row

pvFields("Amount").Orientation = PivotFieldOrientation.Data

' Product will in Position 1 and Category in Position 2.
pvFields("Category").Position = 1
pvFields("Product").Position = 0
Expand or Collapse Pivot Table Fields
The ShowDetail property of the IPivotItem interface allows you to expand or collapse the details of a pivot item. By default, this property is set to True, which means the item is expanded. Set it to False to collapse the item.
The following code demonstrates how to set collapsed state of two pivot table fields.
C#
IPivotCache pvCache = workbook.PivotCaches.Create("ProductData!A1:F20");
IPivotTable pvTable = pvCache.CreatePivotTable(sheet1.Cells["I1"]);
IPivotFields pvFields = pvTable.PivotFields;

pvFields["Category"].Orientation = PivotFieldOrientation.Row;
pvFields["Product"].Orientation = PivotFieldOrientation.Row;
pvFields["Region"].Orientation = PivotFieldOrientation.Column;
pvFields["Amount"].Orientation = PivotFieldOrientation.Data;

//Set collapsed state.
pvFields["Category"].PivotItems["Fruit"].ShowDetail = false;
pvFields["Category"].PivotItems["Vegetables"].ShowDetail = false;
VB
Dim pvCache As IPivotCache = workbook.PivotCaches.Create("ProductData!A1:F20")
Dim pvTable As IPivotTable = pvCache.CreatePivotTable(sheet1.Cells("I1"))
Dim pvFields As IPivotFields = pvTable.PivotFields

pvFields("Category").Orientation = PivotFieldOrientation.Row
pvFields("Product").Orientation = PivotFieldOrientation.Row
pvFields("Region").Orientation = PivotFieldOrientation.Column
pvFields("Amount").Orientation = PivotFieldOrientation.Data

' Set collapsed state.
pvFields("Category").PivotItems("Fruit").ShowDetail = False
pvFields("Category").PivotItems("Vegetables").ShowDetail = False
Set Number Format
You can use IPivotField.NumberFormat property to configure the number format for pivot table fields to improve readability. This allows you to display numbers as currency, percentages, dates, or use custom formats.
The following code demonstrates how to set number format for pivot table fields.
C#
pvTable.DataFields["Amount"].NumberFormat = "0.00%";VB
pvTable.DataFields("Amount").NumberFormat = "0.00%"Grouped Pivot Table Fields
You can use the IPivotField.AutoGroup() method to automatically group data, or use Group() method to customize grouping periods according to your needs. The following image shows data grouped by quarter in a pivot table.
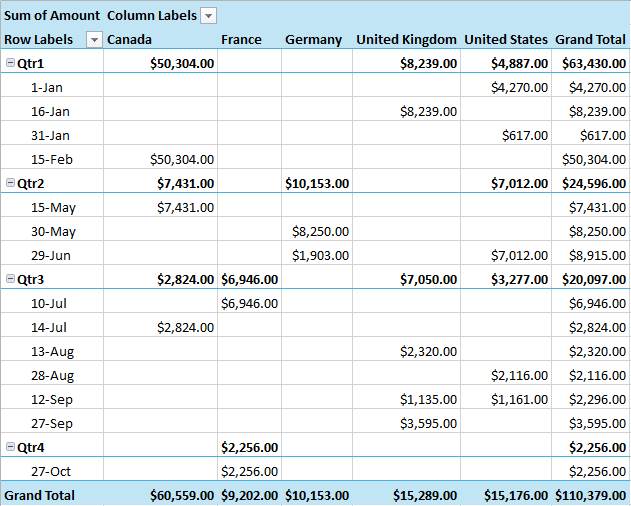
The following example demonstrates how to group data in a pivot table.
C#
IPivotCache pvCache = workbook.PivotCaches.Create("ProductData!A1:F22");
IPivotTable pvTable = pvCache.CreatePivotTable(sheet2.Cells["A1"]);
IPivotFields pvFields = pvTable.PivotFields;
pvTable.AddDataField(pvFields["Amount"]);

IPivotField date = pvFields["Date"];
date.Orientation = PivotFieldOrientation.Row;

IPivotField country = pvFields["Country"];
country.Orientation = PivotFieldOrientation.Column;

// Enable automatic grouping.
date.AutoGroup();

// Set custom grouping periods.
sheet2.Cells["A3"].Group(null, null, null, periods: new PivotGroupPeriods[] { PivotGroupPeriods.Days,  PivotGroupPeriods.Quarters });
VB
Dim pvCache As IPivotCache = workbook.PivotCaches.Create("ProductData!A1:F22")
Dim pvTable As IPivotTable = pvCache.CreatePivotTable(sheet2.Cells("A1"))
Dim pvFields As IPivotFields = pvTable.PivotFields
pvTable.AddDataField(pvFields("Amount"))

Dim [date] As IPivotField = pvFields("Date")
[date].Orientation = PivotFieldOrientation.Row

Dim country As IPivotField = pvFields("Country")
country.Orientation = PivotFieldOrientation.Column

' Enable automatic grouping.
[date].AutoGroup()

' Set custom grouping periods.
sheet2.Cells("A3").Group(Nothing, Nothing, Nothing, periods:=New PivotGroupPeriods() {PivotGroupPeriods.Days, PivotGroupPeriods.Quarters})
Calculated Pivot Table Fields
Apply Different Calculations on a Pivot Field
In Spread WinForms, you can add the same pivot table field to a pivot table multiple times by invoking the AddDataField method with different calculation functions, such as sum, average, min, max, count etc. The final pivot table output will contain multiple data fields based on the calculations applied over the pivot table field.
Refer to the following example code to add a pivot table field as multiple data fields by applying different calculation functions.
C#
fpSpread1.BorderCollapse = BorderCollapse.Enhanced;
IWorkbook workbook = fpSpread1.AsWorkbook();
IWorksheet sheet1 = workbook.ActiveSheet;
sheet1.Name = "ProductData";

// Set data.
sheet1.SetValue(0, 0, new object[,] {
    { "Order ID", "Product",  "Category",   "Amount", "Date",                    "Country" },
    { 1,          "Carrots",  "Vegetables",  4270,    new DateTime(2012, 1, 6),  "United States" },
    { 2,          "Broccoli", "Vegetables",  8239,    new DateTime(2012, 1, 7),  "United Kingdom" },
    { 3,          "Banana",   "Fruit",       617,     new DateTime(2012, 1, 8),  "United States" },
    { 4,          "Banana",   "Fruit",       8384,    new DateTime(2012, 1, 10), "Canada" },
    { 5,          "Beans",    "Vegetables",  2626,    new DateTime(2012, 1, 10), "Germany" },
    { 6,          "Orange",   "Fruit",       3610,    new DateTime(2012, 1, 11), "United States" },
    { 7,          "Broccoli", "Vegetables",  9062,    new DateTime(2012, 1, 11), "Australia" },
    { 8,          "Banana",   "Fruit",       6906,    new DateTime(2012, 1, 16), "New Zealand" },
    { 9,          "Apple",    "Fruit",       2417,    new DateTime(2012, 1, 16), "France" },
    { 10,         "Apple",    "Fruit",       7431,    new DateTime(2012, 1, 16), "Canada" },
    { 11,         "Banana",   "Fruit",       8250,    new DateTime(2012, 1, 16), "Germany" },
    { 12,         "Broccoli", "Vegetables",  7012,    new DateTime(2012, 1, 18), "United States" },
    { 13,         "Carrots",  "Vegetables",  1903,    new DateTime(2012, 1, 20), "Germany" },
    { 14,         "Broccoli", "Vegetables",  2824,    new DateTime(2012, 1, 22), "Canada" },
    { 15,         "Apple",    "Fruit",       6946,    new DateTime(2012, 1, 24), "France" },
    { 16,         "Cola",     "Drink",       3550,    new DateTime(2012, 1, 25), "United States" },
    { 17,         "Juice",    "Drink",       4200,    new DateTime(2012, 1, 26), "France" },
    { 18,         "Beer",     "Drink",       5120,    new DateTime(2012, 1, 28), "Germany" },
    { 19,         "Wine",     "Drink",       8020,    new DateTime(2012, 1, 29), "Italy" },
});

// Config pivot table's fields.
IPivotCache pvCache = workbook.PivotCaches.Create("ProductData!A1:F20");
IPivotTable pvTable = pvCache.CreatePivotTable(sheet1.Cells["I1"]);
IPivotFields pvFields = pvTable.PivotFields;
pvFields["Category"].Orientation = PivotFieldOrientation.Row;
pvFields["Product"].Orientation = PivotFieldOrientation.Row;
pvFields["Order ID"].Orientation = PivotFieldOrientation.Page;

// Apply the Sum function.
pvTable.AddDataField(pvFields["Amount"], "Sum of Amount", ConsolidationFunction.Sum);

// Apply the Count function.
pvTable.AddDataField(pvFields["Amount"], "Count of amount", ConsolidationFunction.Count);
VB
fpSpread1.BorderCollapse = BorderCollapse.Enhanced
Dim workbook As IWorkbook = fpSpread1.AsWorkbook()
Dim sheet1 As IWorksheet = workbook.ActiveSheet
sheet1.Name = "ProductData"

' Set data.
sheet1.SetValue(0, 0, New Object(,) {
    {"Order ID", "Product",  "Category",   "Amount", "Date",                    "Country"},
    {1,          "Carrots",  "Vegetables",  4270,    New DateTime(2012, 1, 6),  "United States"},
    {2,          "Broccoli", "Vegetables",  8239,    New DateTime(2012, 1, 7),  "United Kingdom"},
    {3,          "Banana",   "Fruit",       617,     New DateTime(2012, 1, 8),  "United States"},
    {4,          "Banana",   "Fruit",       8384,    New DateTime(2012, 1, 10), "Canada"},
    {5,          "Beans",    "Vegetables",  2626,    New DateTime(2012, 1, 10), "Germany"},
    {6,          "Orange",   "Fruit",       3610,    New DateTime(2012, 1, 11), "United States"},
    {7,          "Broccoli", "Vegetables",  9062,    New DateTime(2012, 1, 11), "Australia"},
    {8,          "Banana",   "Fruit",       6906,    New DateTime(2012, 1, 16), "New Zealand"},
    {9,          "Apple",    "Fruit",       2417,    New DateTime(2012, 1, 16), "France"},
    {10,         "Apple",    "Fruit",       7431,    New DateTime(2012, 1, 16), "Canada"},
    {11,         "Banana",   "Fruit",       8250,    New DateTime(2012, 1, 16), "Germany"},
    {12,         "Broccoli", "Vegetables",  7012,    New DateTime(2012, 1, 18), "United States"},
    {13,         "Carrots",  "Vegetables",  1903,    New DateTime(2012, 1, 20), "Germany"},
    {14,         "Broccoli", "Vegetables",  2824,    New DateTime(2012, 1, 22), "Canada"},
    {15,         "Apple",    "Fruit",       6946,    New DateTime(2012, 1, 24), "France"},
    {16,         "Cola",     "Drink",       3550,    New DateTime(2012, 1, 25), "United States"},
    {17,         "Juice",    "Drink",       4200,    New DateTime(2012, 1, 26), "France"},
    {18,         "Beer",     "Drink",       5120,    New DateTime(2012, 1, 28), "Germany"},
    {19,         "Wine",     "Drink",       8020,    New DateTime(2012, 1, 29), "Italy"}
})

' Config pivot table's fields.
Dim pvCache As IPivotCache = workbook.PivotCaches.Create("ProductData!A1:F20")
Dim pvTable As IPivotTable = pvCache.CreatePivotTable(sheet1.Cells("I1"))
Dim pvFields As IPivotFields = pvTable.PivotFields
pvFields("Category").Orientation = PivotFieldOrientation.Row
pvFields("Product").Orientation = PivotFieldOrientation.Row
pvFields("Order ID").Orientation = PivotFieldOrientation.Page

' Apply the Sum function.
pvTable.AddDataField(pvFields("Amount"), "Sum of Amount", ConsolidationFunction.Sum)

' Apply the Count function.
pvTable.AddDataField(pvFields("Amount"), "Count of amount", ConsolidationFunction.Count)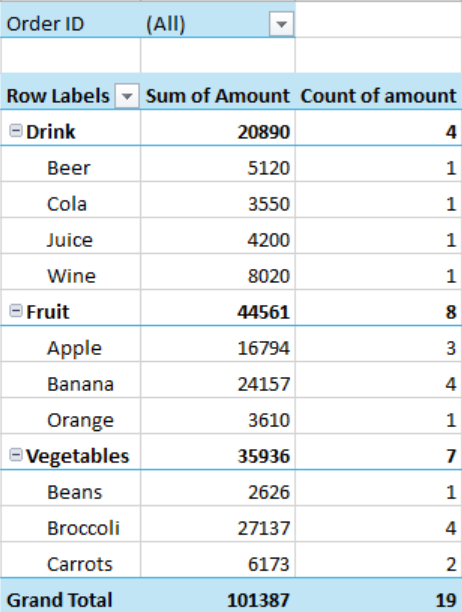
Calculated Fields
You can add custom fields into the value field area of a pivot table which calculates values using formulas. You can use constants or refer to other fields of the pivot table in the formula.
In Spread WinForms, CalculatedFields property represents the collection of all calculated fields in a particular pivot table. You can use Add method of the ICalculatedFields interface to create a new calculated field in the pivot table. The Add method accepts fieldname and formula property as its parameters to generate the calculated field.
Refer to the following code to create a calculated field to calculate the number of sales for products, assuming the formula for sales quantity is IF(Amount > 1000, 30%*Amount, 0).
C#
// Add pivot table.
IPivotCache pvCache = workbook.PivotCaches.Create("ProductData!A1:F20");
IPivotTable pvTable = pvCache.CreatePivotTable(sheet1.Cells["I1"]);
IPivotFields pvFields = pvTable.PivotFields;
pvFields["Category"].Orientation = PivotFieldOrientation.Row;
pvFields["Product"].Orientation = PivotFieldOrientation.Row;
pvFields["Order ID"].Orientation = PivotFieldOrientation.Page;

pvTable.AddDataField(pvFields["Amount"], "Sum of Amount", ConsolidationFunction.Sum);

// Add calculated field.
pvTable.CalculatedFields.Add("Sales", "IF(Amount > 1000, 30 % *Amount, 0)");

// Set calculated field as data field.
pvTable.PivotFields["Sales"].Orientation = PivotFieldOrientation.Data;
pvTable.DataFields["Sum of Amount"].NumberFormat = "#,##0_);(#,##0)";
pvTable.DataFields["Sales"].NumberFormat = "#,##0_);(#,##0)";
VB
' Add pivot table.
Dim pvCache As IPivotCache = workbook.PivotCaches.Create("ProductData!A1:F20")
Dim pvTable As IPivotTable = pvCache.CreatePivotTable(sheet1.Cells("I1"))
Dim pvFields As IPivotFields = pvTable.PivotFields
pvFields("Category").Orientation = PivotFieldOrientation.Row
pvFields("Product").Orientation = PivotFieldOrientation.Row
pvFields("Order ID").Orientation = PivotFieldOrientation.Page

pvTable.AddDataField(pvFields("Amount"), "Sum of Amount", ConsolidationFunction.Sum)

' Add calculated field.
pvTable.CalculatedFields.Add("Sales", "IF(Amount > 1000, 30%*Amount, 0)")

' Set calculated field as data field.
pvTable.PivotFields("Sales").Orientation = PivotFieldOrientation.Data
pvTable.DataFields("Sum of Amount").NumberFormat = "#,##0_);(#,##0)"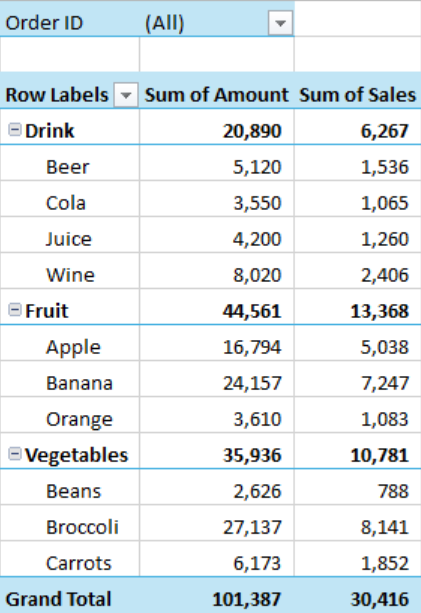
Calculated Items
Calculated items are pivot table items that use custom formulas containing constants or refer to other items in the pivot table. These items can be added to the row or column field area of the pivot table but do not exist in the source data.
ICalculatedItems interface represents the collection of calculated items in a particular pivot table. To add calculated items to a pivot table, the ICalculatedItems interface provides Add method which accepts name and formula of the item as parameters.
Refer to the following code to create a calculated item "[Banana]+[Apple]" in a pivot table.
C#
IPivotCache pvCache = workbook.PivotCaches.Create("ProductData!A1:G20");
IPivotTable pvTable = pvCache.CreatePivotTable(sheet1.Cells["I1"]);
IPivotFields pvFields = pvTable.PivotFields;
pvTable.AddDataField(pvFields["Amount"], "Sum of Amount", ConsolidationFunction.Sum);

pvFields["Product"].Orientation = PivotFieldOrientation.Row;
pvFields["Country"].Orientation = PivotFieldOrientation.Column;
pvFields["Order ID"].Orientation = PivotFieldOrientation.Page;

// Add Calculated Item "[Banana]+[Apple]" which is equal to "Product[Banana]+Product[Apple]"
ICalculatedItems CategoryCalcItems = pvTable.PivotFields["Product"].CalculatedItems;
CategoryCalcItems.Add("[Banana]+[Apple]", "=Product[Banana]+Product[Apple]");
VB
Dim pvCache As IPivotCache = workbook.PivotCaches.Create("ProductData!A1:G20")
Dim pvTable As IPivotTable = pvCache.CreatePivotTable(sheet1.Cells("I1"))
Dim pvFields As IPivotFields = pvTable.PivotFields
pvTable.AddDataField(pvFields("Amount"), "Sum of Amount", ConsolidationFunction.Sum)

pvFields("Product").Orientation = PivotFieldOrientation.Row
pvFields("Country").Orientation = PivotFieldOrientation.Column
pvFields("Order ID").Orientation = PivotFieldOrientation.Page

' Add Calculated Item "[Banana]+[Apple]" which is equal to "Product[Banana]+Product[Apple]"
Dim CategoryCalcItems As ICalculatedItems = pvTable.PivotFields("Product").CalculatedItems
CategoryCalcItems.Add("[Banana]+[Apple]", "=Product[Banana]+Product[Apple]")
Show Value As
While analyzing spreadsheet data, instead of comparing exact values, you may want to compare the values in terms of calculations. For instance, there are many ways to evaluate performance of a sales employee. You can compare his sales with target, sales as a percentage of total sales or sales in comparison to previous month's sale etc. To achieve these calculations easily, Spread WinForms provides "Show Value As" option which allows you to perform custom calculations in a pivot table by using several predefined formulas such as “% of Parent Total” or “% of Column”.
Spread WinForms provides Calculation property of IPivotField interface which accepts values from PivotFieldCalculation enumeration for setting the predefined calculations. You can also set the base field and base field item to perform these calculations using BaseField and BaseItem properties respectively.
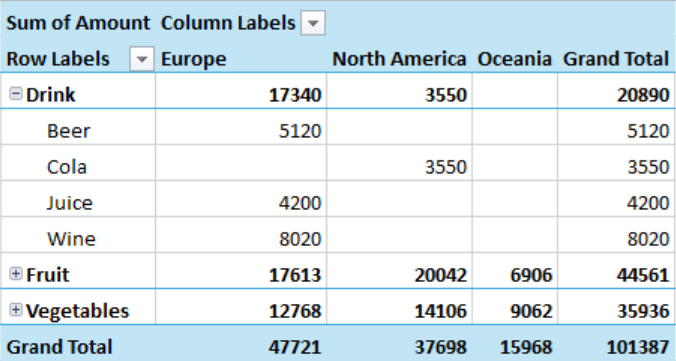
Refer to the following code to display the values as a percentage of the column.
C#
IPivotCache pvCache = workbook.PivotCaches.Create("ProductData!A1:G20");
IPivotTable pvTable = pvCache.CreatePivotTable(sheet1.Cells["I1"]);
IPivotFields pvFields = pvTable.PivotFields;
pvFields["Product"].Orientation = PivotFieldOrientation.Row;
pvFields["Region"].Orientation = PivotFieldOrientation.Column;
pvFields["Amount"].Orientation = PivotFieldOrientation.Data;

// Set the calculation type to "Percent of Column Total".
IPivotField percentOfTableDataField = pvTable.DataFields["Amount"];
percentOfTableDataField.Calculation = PivotFieldCalculation.PercentOfColumn;

// Uncomment below for calculating "Percent Of" a specific base item.
/*
percentOfTableDataField.Calculation = PivotFieldCalculation.PercentOf;
percentOfTableDataField.SetBaseField("Product"); // Set the base field to "Product"
percentOfTableDataField.SetBaseItem("Banana"); // Set the base item to "Banana"
*/
pvTable.DataFields["Amount"].NumberFormat = "0.00%";
VB
Dim pvCache As IPivotCache = workbook.PivotCaches.Create("ProductData!A1:G20")
Dim pvTable As IPivotTable = pvCache.CreatePivotTable(sheet1.Cells("I1"))
Dim pvFields As IPivotFields = pvTable.PivotFields
pvFields("Product").Orientation = PivotFieldOrientation.Row
pvFields("Region").Orientation = PivotFieldOrientation.Column
pvFields("Amount").Orientation = PivotFieldOrientation.Data

' Set the calculation type to "Percent of Column Total".
Dim percentOfTableDataField As IPivotField = pvTable.DataFields("Amount")
percentOfTableDataField.Calculation = PivotFieldCalculation.PercentOfColumn

' Uncomment below for calculating "Percent Of" a specific base item.
'percentOfTableDataField.Calculation = PivotFieldCalculation.PercentOf
'percentOfTableDataField.SetBaseField("Product") ' Set the base field to "Product"
'percentOfTableDataField.SetBaseItem("Banana") ' Set the base item to "Banana"

pvTable.DataFields("Amount").NumberFormat = "0.00%"
Note: Spread WinForms exhibits the same behavior as Microsoft Excel in the following aspects.
You cannot add a calculated item to a page field. In addition, you cannot move a row or column field containing calculated items to the page area of the PivotTable report.
You cannot add a calculated item to a grouped field. Ungroup the field before inserting a calculated item.
You cannot add multiple copies of a field containing calculated items to the data area.
You cannot add a calculated item to a PivotTable report if the data area uses the Average, StdDev, StdDevp, Var, or Varp function.
You cannot create formulas that use cell references, defined names, circular references, or arrays.
You cannot use worksheet functions that require cell references or defined names as arguments.
Formulas cannot refer to the PivotTable’s subtotals, totals, or Grand Total values.