
-
Spread for ASP.NET Product Documentation
-
Developer's Guide
- Getting Started
- Understanding the Product
- Namespaces Overview
- Working with the Spread Designer
- Customizing User Interaction
- Customizing the Appearance
- Customizing with Cell Types
- Managing Data Binding
- Managing Data in the Component
- Managing Formulas
- Managing File Operations
- Using Sheet Models
- Maintaining State
- Working with the Chart Control
- Using Touch Support with the Component
- Assembly Reference
- Client-Side Scripting Reference
- Import and Export Reference
-
Developer's Guide
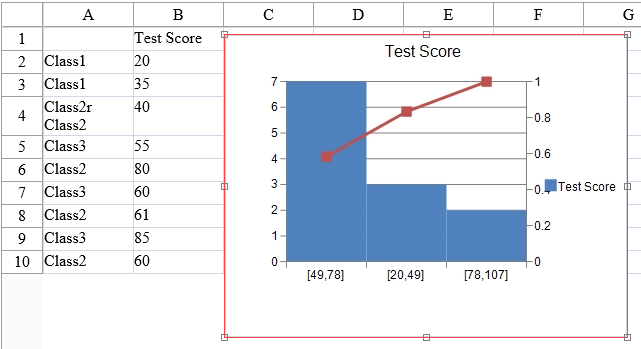
Pareto Charts
A pareto chart contains both bars and a line graph. Individual values are represented in descending order by bars and the cumulative total is represented by the line. The pareto chart is used to highlight the most important items in a set of values.
For information about creating charts in the Spread Designer or the Chart Designer, refer to Using the Spread Designer or Using the Chart Designer.
Using Code
Add data to the control.
Add a chart to the Spread control using the ParetoSeries class.
Example
The following example creates a pareto chart.
FpSpread1.ActiveSheetView.RowCount = 30;
FpSpread1.ActiveSheetView.ColumnCount = 10;
FpSpread1.ActiveSheetView.Cells[0, 1].Text = "Test Score";
FpSpread1.ActiveSheetView.SetClipValue(1, 0, 13, 1, "Class1\r\nClass1\r\nClass2r\nClass2\r\nClass3\r\nClass2\r\nClass3\r\nClass2\r\nClass3\r\nClass2\r\nClass2\r\nClass3");
FpSpread1.ActiveSheetView.SetClipValue(1, 1, 13, 1, "20\r\n35\r\n40\r\n55\r\n80\r\n60\r\n61\r\n85\r\n60\r\n60\r\n64\r\n75");
FpSpread1.ActiveSheetView.AddChart(new FarPoint.Web.Spread.Model.CellRange(0, 0, 13, 2), typeof(FarPoint.Web.Chart.ParetoSeries), 400, 300, 150, 0);
FpSpread1.ActiveSheetView.RowCount = 30
FpSpread1.ActiveSheetView.ColumnCount = 10
FpSpread1.ActiveSheetView.Cells(0, 1).Text = "Test Score"
FpSpread1.ActiveSheetView.SetClipValue(1, 0, 13, 1, "Class1" & vbCr & vbLf & "Class1" & vbCr & vbLf & "Class2r" & vbLf & "Class2" & vbCr & vbLf & "Class3" & vbCr & vbLf & "Class2" & vbCr & vbLf & "Class3" & vbCr & vbLf & "Class2" & vbCr & vbLf & "Class3" & vbCr & vbLf & "Class2" & vbCr & vbLf & "Class2" & vbCr & vbLf & "Class3")
FpSpread1.ActiveSheetView.SetClipValue(1, 1, 13, 1, "20" & vbCr & vbLf & "35" & vbCr & vbLf & "40" & vbCr & vbLf & "55" & vbCr & vbLf & "80" & vbCr & vbLf & "60" & vbCr & vbLf & "61" & vbCr & vbLf & "85" & vbCr & vbLf & "60" & vbCr & vbLf & "60" & vbCr & vbLf & "64" & vbCr & vbLf & "75")
FpSpread1.ActiveSheetView.AddChart(New FarPoint.Web.Spread.Model.CellRange(0, 0, 13, 2), GetType(FarPoint.Web.Chart.ParetoSeries), 400, 300, 150, 0)Using the Chart Designer
Select the PlotArea Collection editor.
Set properties as needed.
Select Apply and OK to close the Chart Designer.