


- SpreadJS Overview
- Getting Started
- JavaScript Frameworks
- Best Practices
-
Features
- Workbook
- Worksheet
- Rows and Columns
- Headers
- Cells
- Data Binding
- Data Manager
- TableSheet
-
GanttSheet
- Create GanttSheet
- Data Manager
- Add Hierarchy Types
- Gantt Chart Components
- Task Properties
- CRUD Operations
- Task Operations
- Non-Working Time
- Table Themes
- Taskbar Styles
- Task Layout
- Gridlines
- Progress Line
- Zoom
- Scroll
- Timescale Range and Auto Fit
- Splitter Handle
- Context Menu
- Sort
- Calendar Settings
- GanttSheet IO
- Resource and Assignment
- ReportSheet
- Data Charts
- JSON Schema with SpreadJS
- SpreadJS File Format
- Data Validation
- Conditional Formatting
- Sort
- Group
- Formulas
- What-If Analysis
- Serialization
- Keyboard Actions
- Shapes
- Floating Objects
- Barcodes
- Charts
- Sparklines
- Tables
- Pivot Table
- Slicer
- Theme
- User Management
- Culture
- AI Assistant
- SpreadJS Designer
- SpreadJS Designer VSCode Plugin
- Tutorials
- SpreadJS Designer Component
- SpreadJS Collaboration Server
- Touch Support
- Formula Reference
- Import and Export Reference
- Events
- API Documentation
- Release Notes
Gridlines
Gridlines are the vertical and horizontal lines that make your Gantt chart more readable. They help to match up a Gantt chart taskbar with the corresponding task in the project table. You can change the appearance and interval styles of the gridlines to better reflect the scope of the project.
Gridline Format Styles
Gridline formats have two styles:
Normal style: This style has two format properties:
lineTypeandlineColorof GC.Spreadsheet.GanttSheet.GanttGridline interface.At Interval style: This style defines both the normal and alternating styles at the same time, inheriting the
lineTypeandlineColorproperties from the Normal style. It also includesinterval,intervalLineType, andintervalLineColorproperties of the GC.Spread.Sheet.GanttSheet.GanttGridlineInterval interface to apply to the interval gridlines.
Configurable Gridline Types
There are different categories of gridlines used in a Gantt chart. You can configure gridlines using the available properties of GC.Spread.Sheets.GanttSheet.GanttGridlines class as discussed in the below sections.
Timescale Extension Gridline
This Normal style gridline separates timescale columns. To change the gridline type and color of timescale tier columns, set the lineType and lineColor properties for topTierColumn, middleTierColumn, and bottomTierColumn.
Note: In the Gantt chart area,
The bottomTierColumn gridline is covered by the middleTierColumn and topTierColumn gridlines respectively.
The middleTierColumn gridline is covered by the topTierColumn gridline.
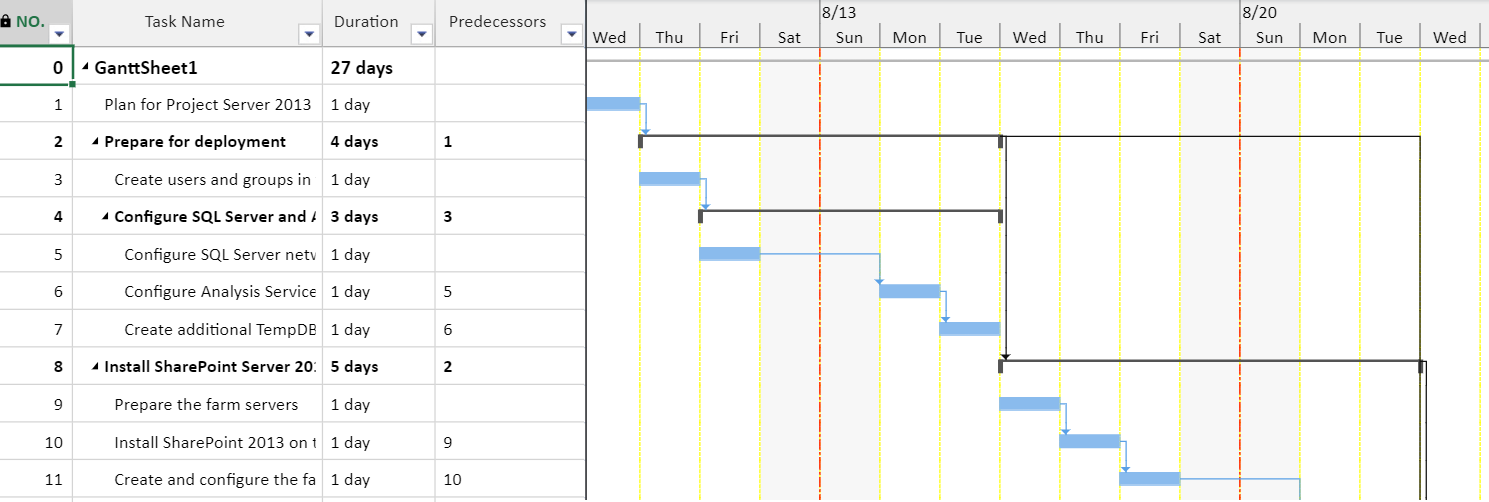
The following code sample shows how to change the gridline of the bottom and middle tier columns.
// Change gridline of bottom tier column with dashed type and yellow color.
ganttSheet.gridlines.bottomTierColumn = {
    lineType: GC.Spread.Sheets.GanttSheet.GanttGridlineType.dashed,
    lineColor: "yellow"
}
// Change gridline of middle tier column with dash-dot type and red color.
ganttSheet.gridlines.middleTierColumn = {
    lineType: GC.Spread.Sheets.GanttSheet.GanttGridlineType.dashDot,
    lineColor: "red"
}
The output of the above code will look like below.
Project Helper Gridline
This Normal style gridline highlights project-level dates in the Gantt chart, including the current date, status date, project start date, and project finish date. These gridlines help users identify important project reference dates and project boundaries.
To change the gridline type and color of project-level dates, set the lineType and lineColor properties for currentDate, statusDate, projectStart, and projectFinish.
Note: In the Gantt chart area,
The projectStart gridline is covered by projectFinish, currentDate, and statusDate gridlines respectively.
The projectFinish gridline is covered by currentDate and statusDate gridlines.
The bottomTierColumn, middleTierColumn, and topTierColumn gridlines are covered by projectStart, projectFinish, currentDate, and statusDate gridlines.
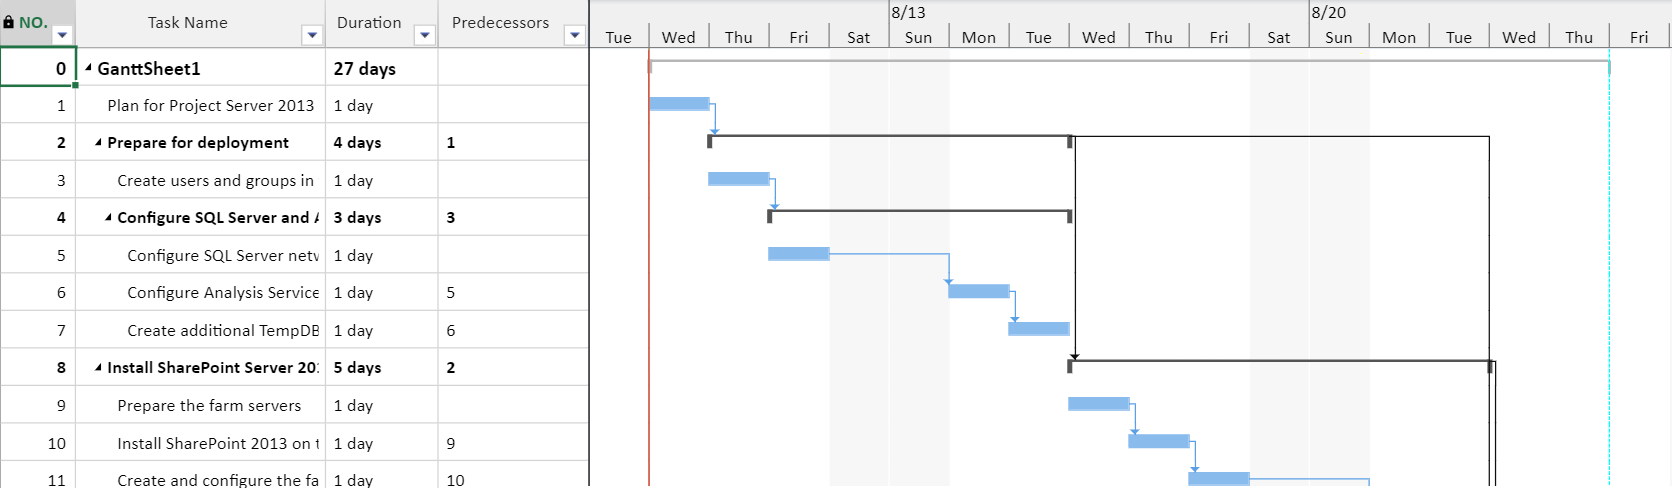
The following code sample shows how to change the gridline of the start and finish project.
// Change gridline of project start with thin type and red color.
 ganttSheet.gridlines.projectStart = {
    lineType: GC.Spread.Sheets.GanttSheet.GanttGridlineType.thin,
    lineColor: "red"
};
// Change gridline of project finish with dashed type and aqua color.
ganttSheet.gridlines.projectFinish = {
    lineType: GC.Spread.Sheets.GanttSheet.GanttGridlineType.dashed,
    lineColor: "aqua"
};
The output of the above code will look like below.
The following code sample shows how to configure the Current Date and Status Date gridlines.
// Change the Current Date gridline.
ganttSheet.gridlines.currentDate = {
    lineType: GC.Spread.Sheets.GanttSheet.GanttGridlineType.thin,
    lineColor: "green"
};

// Set the project status date.
ganttSheet.project.statusDate = new Date(2026, 6, 27);

// Change the Status Date gridline.
ganttSheet.gridlines.statusDate = {
    lineType: GC.Spread.Sheets.GanttSheet.GanttGridlineType.dashDot,
    lineColor: "#5B9BD5"
};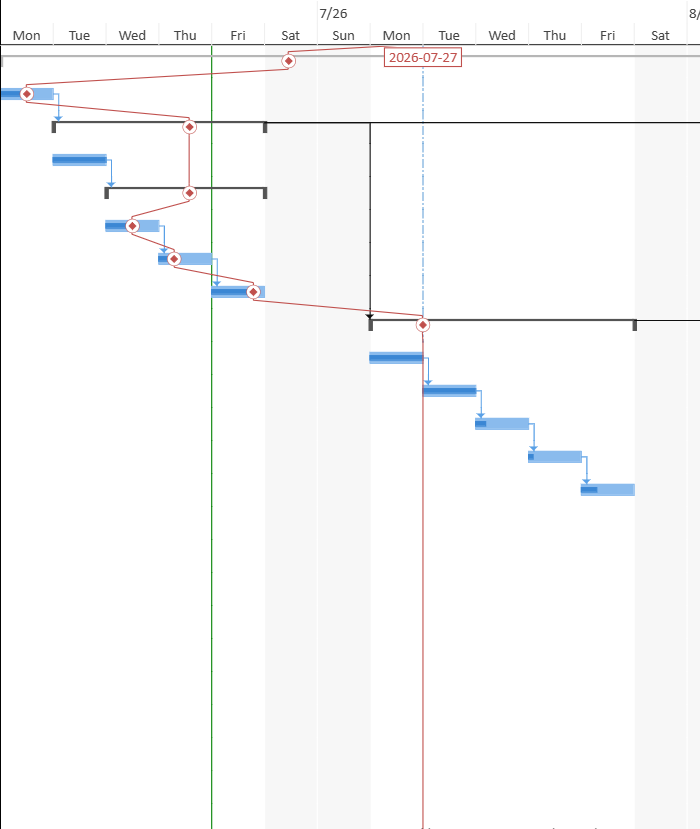
The Status Date gridline is displayed independently from the Progress Line. You can display the Status Date gridline without displaying a Progress Line, or use both together.
When displayed, the Status Date gridline is drawn at the right edge of the corresponding timescale cell so that it aligns with the Progress Line reference-date anchor.
Taskbar Separation Gridline
This At Interval style gridline separates the task rows. You can add an interval gridline between rows to align the task rows and change their type and color by using the interval, intervalLineType, and intervalLineColor properties.
The following code sample shows how to change the interval gridline of ganttrows.
// Change interval gridline of gantt rows to with dashed type and red color.
ganttSheet.gridlines.ganttRows = {
    lineType: GC.Spread.Sheets.GanttSheet.GanttGridlineType.thin,
    lineColor: "blue",
    interval: 2,
    intervalLineType: GC.Spread.Sheets.GanttSheet.GanttGridlineType.dashed,
    intervalLineColor: "red"
}