
- SpreadJS Overview
- Getting Started
- JavaScript Frameworks
- Best Practices
- Features
- SpreadJS Designer
- Tutorials
-
SpreadJS Designer Component
- Getting Started
- Quick Start
- Theme
- Designer Interface
- JavaScript Frameworks
- Customizations
-
Work in Designer Component
- AutoSum Functions
- Set Range Template Cell
- Name Box
- Select Cells Using Go To
- Find and Replace
- Edit Font Size
- Edit Font Family
- Manage Conditional Formatting Rules
- Shape Selection Pane
- Automatic Outline
- Format Painter
- Table Slicer
- TableSheet
- GanttSheet Designer
- ReportSheet Designer
- Data Chart Designer
- Text to Columns
- Remove Duplicates
- Pivot Table
- Dockable Side Panel
- Command Palette
- Transform Cells with LAMBDA Formula
- Toolbar Ribbon
- API Documentation
- SpreadJS Collaboration Server
- Touch Support
- Formula Reference
- Import and Export Reference
- Frequently Used Events
- API Documentation
- Release Notes
Transform Cells with LAMBDA Formula
The Transform Cells feature allows users to apply custom single-parameter LAMBDA formulas to selected cell ranges. Users can choose how the formula parameter is scoped—by cell, row, column, or entire range.
After conversion, the source cell range is cleared, and the converted range is applied to the worksheet. Cell styles remain unchanged after conversion; only stored cell values change.
type=note
Notes:
Valid Formula:
=LAMBDA(x, <expression using x>)Only one continuous range is supported.
Only normal worksheet ranges are supported—not on report sheets, table sheets, Gantt sheets, tables, pivot tables, or data ranges.
When a transformation yields a dynamic array result, the output will spill across adjacent cells based on the maximum number of rows and columns generated across all transformations. Refer to Sample 3.
If the transformation output exceeds the bounds of the current worksheet range, the excess portion will be clipped.
Usage Instructions
Select a single continuous cell range on a normal worksheet.
Right-click and choose Transform Cells.
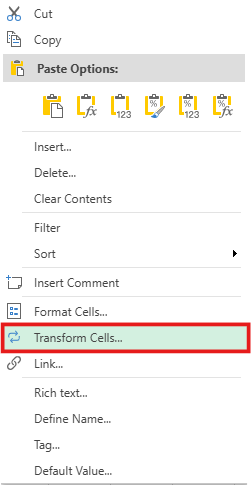
In the dialog:
a. Enter a single-parameter LAMBDA formula in the Formula field. Supports auto-suggesting formulas during input.
b. Select the desired Scope.
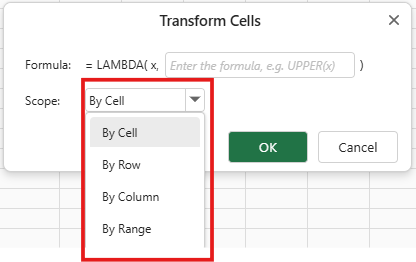
Click OK. The original range is cleared and replaced with transformed values. Styles remain unchanged.
Samples
Sample 1: Sum the Industrial Data by Column
Source Cell Range:

Formula:
=LAMBDA(x, SUM(x))Scope: By Column
Sample 2: Convert Text to Uppercase by Cell
Source Cell Range:
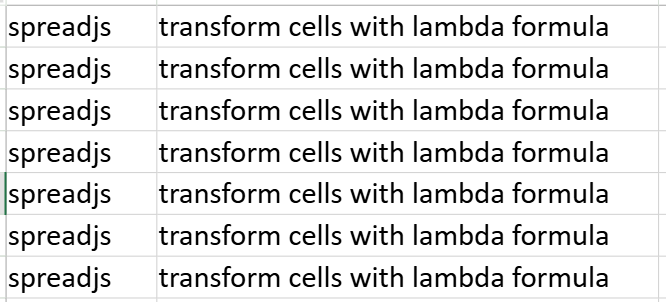
Formula:
=LAMBDA(x, UPPER(x))Scope: By Cell
Sample 3: Split Order Details by Semicolon and Comma
Source Cell Range:
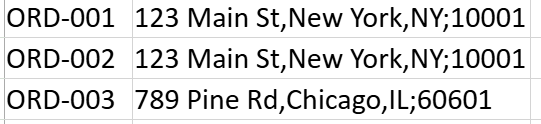
Formula:
=LAMBDA(x, TEXTSPLIT(x, ";", ","))Scope: By Cell
The original data has a 3x2 structure. When transformed,
each row expands to a maximum of 3 sub-rows based on the defined splitting logic, so the total number of rows becomes 3 (original rows) × 3 (max expanded sub-rows per row) = 9.
for columns, the content is split and reorganized across 4 columns after transformation.
In summary, the process ensures each row scales to its full potential, resulting in a final output of 9 rows by 4 columns that systematically presents all segmented information.